Nathan Seidle (pronounced sigh-dle) is the founder and CEO of SparkFun Electronics in Boulder, Colo. Nathan founded SparkFun in 2003 while an undergraduate student studying electrical engineering.
The Digital Beehive uses Wi-Fi to broadcast a beehive’s weight, humidity, temperature, and battery voltage every minute to SparkFun’s data channel service called Phant. The raw data can be seen here but you can view some prettier graphs of the data here on analog.io (sign-in required).
On a visit to Portland, Oregon, last summer my friend mentioned he had always wanted to put a load cell under a beehive to measure the weight of the hive over time. He thought it was a great project for SparkFun and I immediately started thinking how it might be done. Fast forward through 9 months of testing and development and we’ve got live bee data!
A) strain gauge B) Wheatstone bridge configuration C) SparkFun’s breakout board for the HX711 chip D) HX711 chip (commonly used in most consumer scales) E) Particle Core F) 12C-based HTU21D breakout sensor board G) 2.5W solar cell H) 6 amp-hour LiPo battery I) Maximum Power Point solar charger J) Arduino Uno K) external 2.4GHz antenna
First a disclaimer: This is a project that focuses on the technology and the lessons in the field, but I have only scratched the surface of beekeeping (apiculture). SparkFun is fortunate to have a handful of employees who are either beekeepers or related to beekeepers. They were nice enough to do the bee tending, I did the tech. Additionally, I am an engineer so data accuracy is important to me but the interpretation of that data should be left to research scientists. That said, check this out!
A healthy hive can hit 400lbs (180kg), so we need to create a scale that can handle the hive’s maximum weight and also have the robustness to survive in the field.
The hacked bathroom scale
There are a variety of 200kg bathroom and package scales available. The vast majority have a similar setup to the scale pictured above. There are four strain gauges (one in each corner) that are wired in a Wheatstone Bridge configuration to create a load cell. You can read more about load cells here.
This configuration of four gauges allows for low cost voltage measurement instruments to measure a very minute change in resistance. We’ll need to convert this voltage change to a digital reading. Scale manufacturers use specifically designed ICs to convert the analog voltage reading to digital, the HX711 is one such specialized instrument amplifier that is commonly used inside many consumer scales. So I whipped up a breakout board for the HX711 and started experimenting with this and other postal scales. What I found was discouraging.
Every load cell has creep. This means when you put a 12 pack of Coke on your scale it will read one reading and over the next 15 minutes the reading will change. A lot. For low end human or postal scales this is fine — no one stands on the scale for more than a few seconds, but I planned to leave the scale in place for months on end.
Here are a few lessons I learned about scales:
Don’t skimp on the quality of the scale. A higher quality scale will have less creep and have more durable construction in the field. I ended up using an $80 scale from Amazon that had a 400lbs max with 0.1lbs advertised resolution.
Don’t build your own. While the quality and variance of scales was frustrating, it was far easier to buy and hack a scale then try to jump through the mechanical hoops of building my own scale to withstand forces of 200kg in addition to the rain/sleet/snow of Colorado.
Calibration takes time. I’ll dive into this later but expect to throw lots of known weight on your scale for days at a time to get the calibration points you’ll need.
The HX711 is powered from 2.7 to 5V and uses a 2 wire digital interface (Clock and Data). Thanks to open source and the community there are a variety of libraries that allow an Arduino to talk to the HX711. There is a series of calibration points that needs to be recorded and remembered between power cycles, so I wrote a serial-based menu system that allowed me to read, calibrate, and tare (zero out) the scale from my Arduino.
With the scale mostly under control I moved on to getting the data from the field to a place where it could be stored and accessed easily. There are a handful of data storage services on the internet but SparkFun created an open source and super easy to use software called Phant. We run a free instance of Phant on data.sparkfun.com. If your microcontroller can concatenate a string like this:
Then you can push data (brewTemp of 34.2) to the internet. Try it out yourself by hitting this link then viewing the public stream.
I quickly created a data channel and threw some data at it but I still needed to get from the Arduino across the SparkFun parking lot to the internet. This used to be hard but with recent players like Particle and the ESP8266 the cost and complexity of Wi-Fi has dropped dramatically over the last year.
I chose the Spark Core because I had one from their Kickstarter but with the recent launch of the Particle Photon and the SparkFun Thing there are better and lower cost solutions now available.
Thanks again to the community (you guys rock!), there are some lovely libraries written for the Spark Core to get a variable onto data.sparkfun.com. With a few basic function calls I was moving weight data from my Core to Phant.
A humidity sensor covered in PTFE
Adding humidity and temperature was cheap and easy so I added that to the system thanks to the I2C based HTU21D breakout sensor board. I covered the HTU21D board in PTFE tape. This teflon-based tape is commonly used to seal the threads on your garden hose or irrigation pipes. Teflon allows water vapor to pass back and forth while protecting the sensor in theory from pollen, bee feet, etc.
Because this system will be solar and battery powered I added a voltage divider to measure the voltage on the battery through the ADC on the Spark Core.
The purple board is a prototype of a product called OpenScale that combines an Arduino and HX711 load cell amplifier into one easy to use board. The Core sends a trigger character to OpenScale and OpenScale responds with the comma delimited weight, timestamp, and board temperature. The RJ45 cable pictured is not ethernet, rather it’s the cable that contains the 4-wires that run to the Wheatstone bridge in the load cell within the postal scale.
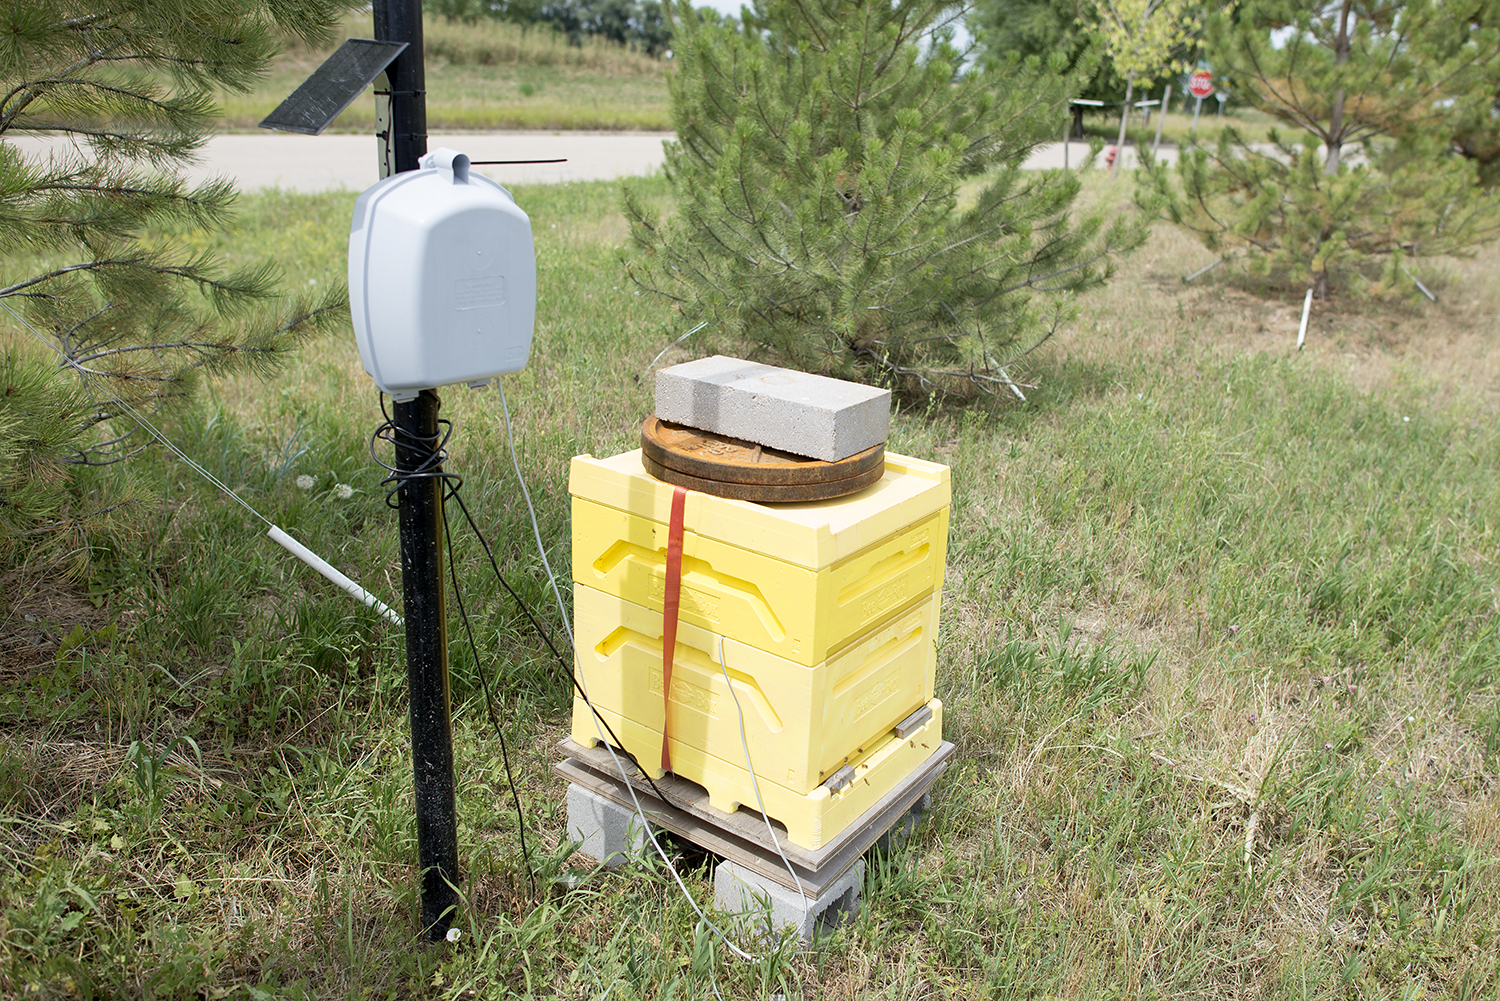
The four tier beehive.
Here we have a Bee Box brand polystyrene beehive from Finland. I was told to use four small concrete blocks (the type with a void in the center) to elevate and thermally isolate the hive. On top of the four blocks are two pieces of untreated plywood sandwiched around the scale. On top of the second piece of plywood is the hive itself. Colorado can have greater than 120mph (193kph) winds so I added two 45 pound weightlifting plates and a 30 pound solid core cinder block. I could have probably done with less weight but the last thing I wanted was the hive to blow over.
The outdoor enclosure, electronics, and solar cell are mounted to a pole near the hive. A wire runs to the scale underneath and a wire runs into the hive which connects to the humidity and temperature sensor.
The 45 pound weightlifting plates were crucial to calibrating the scale. The HX711 returns a 24-bit reading such as 7,885,711. It is up to the user to make sense of this via calibration using a known weight. And because my scale went up to 440 lbs I couldn’t calibrate the scale with a pound or two, I needed a large known source of weight — hence the plates. In the comfort of my home I set the scale on a level, hard surface and took a zero reading. I then put 90 lbs on the scale and left it for a few days. Once the scale had a chance to creep to this new weight I calibrated the reading to 90 pounds. Removing one of the plates indicated 45 pounds on the scale. This allowed me to verify the scale was reading correctly.
Ok, so we’ve got weight, humidity, temperature, and battery voltage. We’ve got the variables pushing to the internet. Now we need some bees.
Pontus, our fearless beekeeper, installed roughly three pounds of bees on April 26 in the berm across from our building. It was a wonderfully wet spring and summer which meant great things for Colorado but made life hard for bees. Once the weather cleared up in July our bees started multiplying rapidly due to the massive bloom of thistle and other weeds in the area.
The point of all this is to get weight data! Here is the raw beehive data stream on data.sparkfun.com. This is great but it’s easier to pick out trends when the data is visualized. The folks at analog.io have made it super easy to link a SparkFun data stream and graph the various bits of data. Here’s beehive weight graphed over time:
Hive weight, humidity, and temperature over 5 days
Look at that! So pretty. We can see the bees leave at 6:20 every morning like clock work. The hive loses many pounds of bees in a few minutes only to have them slowly return over the day.
Hive weight, humidity and temperature over 5 days
Here we can see weight, temperature, and humidity over a few days. Note: For the first few months the HTU21D humidity and temperature sensor was located in the outdoor enclosure, not in the hive. I wanted to make sure the sensor was working reliably before installing it in the hive. It was astonishing to see the bees depart in the morning at the precise time the ambient humidity dropped and temperature rose.
Here you can see the sensor data before and after I added the humidity and temperature sensors to the hive.
I installed the sensor on July 16 during one of Pontus’ regular inspections of the hive. You can see the weight of the hive drop dramatically when we remove the 125 lbs of top weight and then re-add it a few minutes later.
During a Colorado summer the ambient temperature swings from the 50’s at night to the 90’s during the day. A delta of 50°F is shown in the data stream before July 16 with regularity. Bees are wonderful beasts. Once the sensor was installed we can see the internal temperature of the hive is pegged at 89° with a variance of 3°. This is astonishing! Outside mother nature is wreaking havoc but inside the hive the bees are doing a fabulous job of keeping things normal. I am excited to see how they do this winter.
Unfortunately (and you could probably tell this was coming) the sensor did not fare well. Three days later on the 19th of July the temperature and humidity data goes completely haywire and by July 20 the sensor stops reporting. I may have an electrical fault (the landscapers may have sliced the cable) but my guess is the bees have done something creative to the sensor. I will check on it during the next hive inspection.
Graphing the hive’s overall weight gain
We’ve been receiving data from the hive for awhile now. The weight data is often noisy and hard to decipher. For example, I’m not sure why the weight in July was so dramatic. But by connecting the dots of when the hive was inspected (June 19, July 1, July 17) and looking at the overall trend I estimate the hive weight to have increased 21 lbs. That’s approximately a half a pound a day increase! Each day honey, pollen, wax, and bees increase. If a honey bee worker weighs 120mg and if the growth of the hive was entirely in bees that would be the equivalent of adding 1,900 bees a day. Mother nature is amazing.
Conclusion
The project was a wild success. I highly recommend finding a friend who can safely show you around a beehive. It was wonderful getting a chance to see the bees in action.
Although our humidity and temperature sensor failed, the overall weight and Wi-Fi technology continue to perform. I would need to gather data from many more hives across many more seasons but using data like this could help beekeepers to know which hives to check on and the overall health of their bees.
Nathan Seidle (pronounced sigh-dle) is the founder and CEO of SparkFun Electronics in Boulder, Colo. Nathan founded SparkFun in 2003 while an undergraduate student studying electrical engineering.
When you buy through links on our site, we may earn an affiliate commission.
Our websites use cookies to improve your browsing experience. Some of these are essential for the basic functionalities of our websites. In addition, we use third-party cookies to help us analyze and understand usage. These will be stored in your browser only with your consent and you have the option to opt-out. Your choice here will be recorded for all Make.co Websites.
Allow Non-Necessary Cookies
Escape to an island of imagination + innovation as Maker Faire Bay Area returns for its 15th iteration!
Buy Tickets today! SAVE 15% and lock-in your preferred date(s).