Forrest M. Mims III (forrestmims.org), an amateur scientist and Rolex Award winner, was named by Discover magazine as one of the “50 Best Brains in Science.” His books have sold more than 7 million copies.
Six years ago, I described in these pages how to build a twilight photometer (Figure A below) to determine the presence and altitude of overhead layers of smoke, dust, and smog (“Build a Twilight Photometer to Detect Stratospheric Particles,” Make: Volumes 44 and 45).
That two-part article has become a serious project to detect and measure the elevation of stuff in the sky, including dust arriving from Africa’s Sahara Desert, smoke from agricultural fires in Mexico and Central America, and most interestingly, high-altitude cosmic dust that accompanies meteor showers as Earth orbits the sun. Some of this “dust” might actually be space debris — manmade junk orbiting the Earth.
My twilight photometers are much simpler than professional versions, and that original Make: article has been read by 76 scientists who are members of the ResearchGate community and 719 non-members (and, hopefully, many Make: readers). It hasn’t yet been cited in a peer-reviewed scientific paper, but at least one is on the way. Maybe you can build a twilight photometer and cite it in your research. This article can be considered Part 3. Here I describe how the original project, which uses an LED as a photodiode to detect the very weak twilight glow, has been expanded to detect particles high above those in the troposphere and stratosphere. I close with a description of a new kind of low-noise LED twilight photometer.
Figure A. Original LED twilight photometer published in Make: (2015).
Project Steps
Micrometeors
According to the American Meteor Society, most meteors that flash across a dark sky range in size from a grain of sand to a small pebble. Meteors can occur at random or during predictable showers, and each year millions of them survive their trip through Earth’s atmosphere. According to an international study in Antarctica recently reported in Earth and Planetary Science Letters, 5,200 tons of micrometeors reach Earth’s surface every year.
The timing of meteor showers is predictable because they occur when Earth passes through the remnants of the tail of a comet with a well-known orbit around the sun. My twilight photometers detect multiple, well-defined layers of cosmic dust during meteor showers. They also detect random layers of cosmic dust when Earth’s orbit passes through swarms of dust, some of which may have originated from collisions between asteroids.
Space Debris
A recent paper in Monthly Notices of the Royal Astronomical Society by M. Kocifaj and team reports that space debris has increased the intensity of light from the night sky by 10%, which is raising serious concern among both professional and amateur astronomers. As more satellites are launched, the sky glow problem will become even worse.
Figure B. Space objects and debris in low Earth orbit actively tracked by NASA.
It’s possible that some of the aerosols detected by my twilight program are space debris. Millions of fragments from satellite collisions and at least one intentionally destroyed satellite are orbiting Earth. Figure B is a NASA image of space objects within 2,000 km (1,243 mi.) of Earth’s surface as of January 1, 2019, from the Orbital Debris Program Office. Some 95% of these objects are space debris, and only those large enough to be tracked are shown.
The Atmosphere
The atmosphere protects Earth from most meteors. That’s because meteors are moving so fast (25,000mph to 160,000mph) they began to incandesce and burn up when they enter the upper atmosphere. Most space debris eventually meets a similar fate.
The lowest layer of the atmosphere is the troposphere, which is around 10 to 15 kilometers (6–9 miles) thick. The troposphere is where weather occurs. The next layer, the stratosphere, extends from the top of the troposphere (the tropopause) to 50km (31 mi.). Most of the ozone layer is within the stratosphere. The mesosphere lies above the stratosphere and reaches an elevation of 85km (53 mi.). The thermosphere then takes over and reaches several hundred or more miles. Most meteors burn up in the thermosphere from 80–120km (50–75 mi.) high.
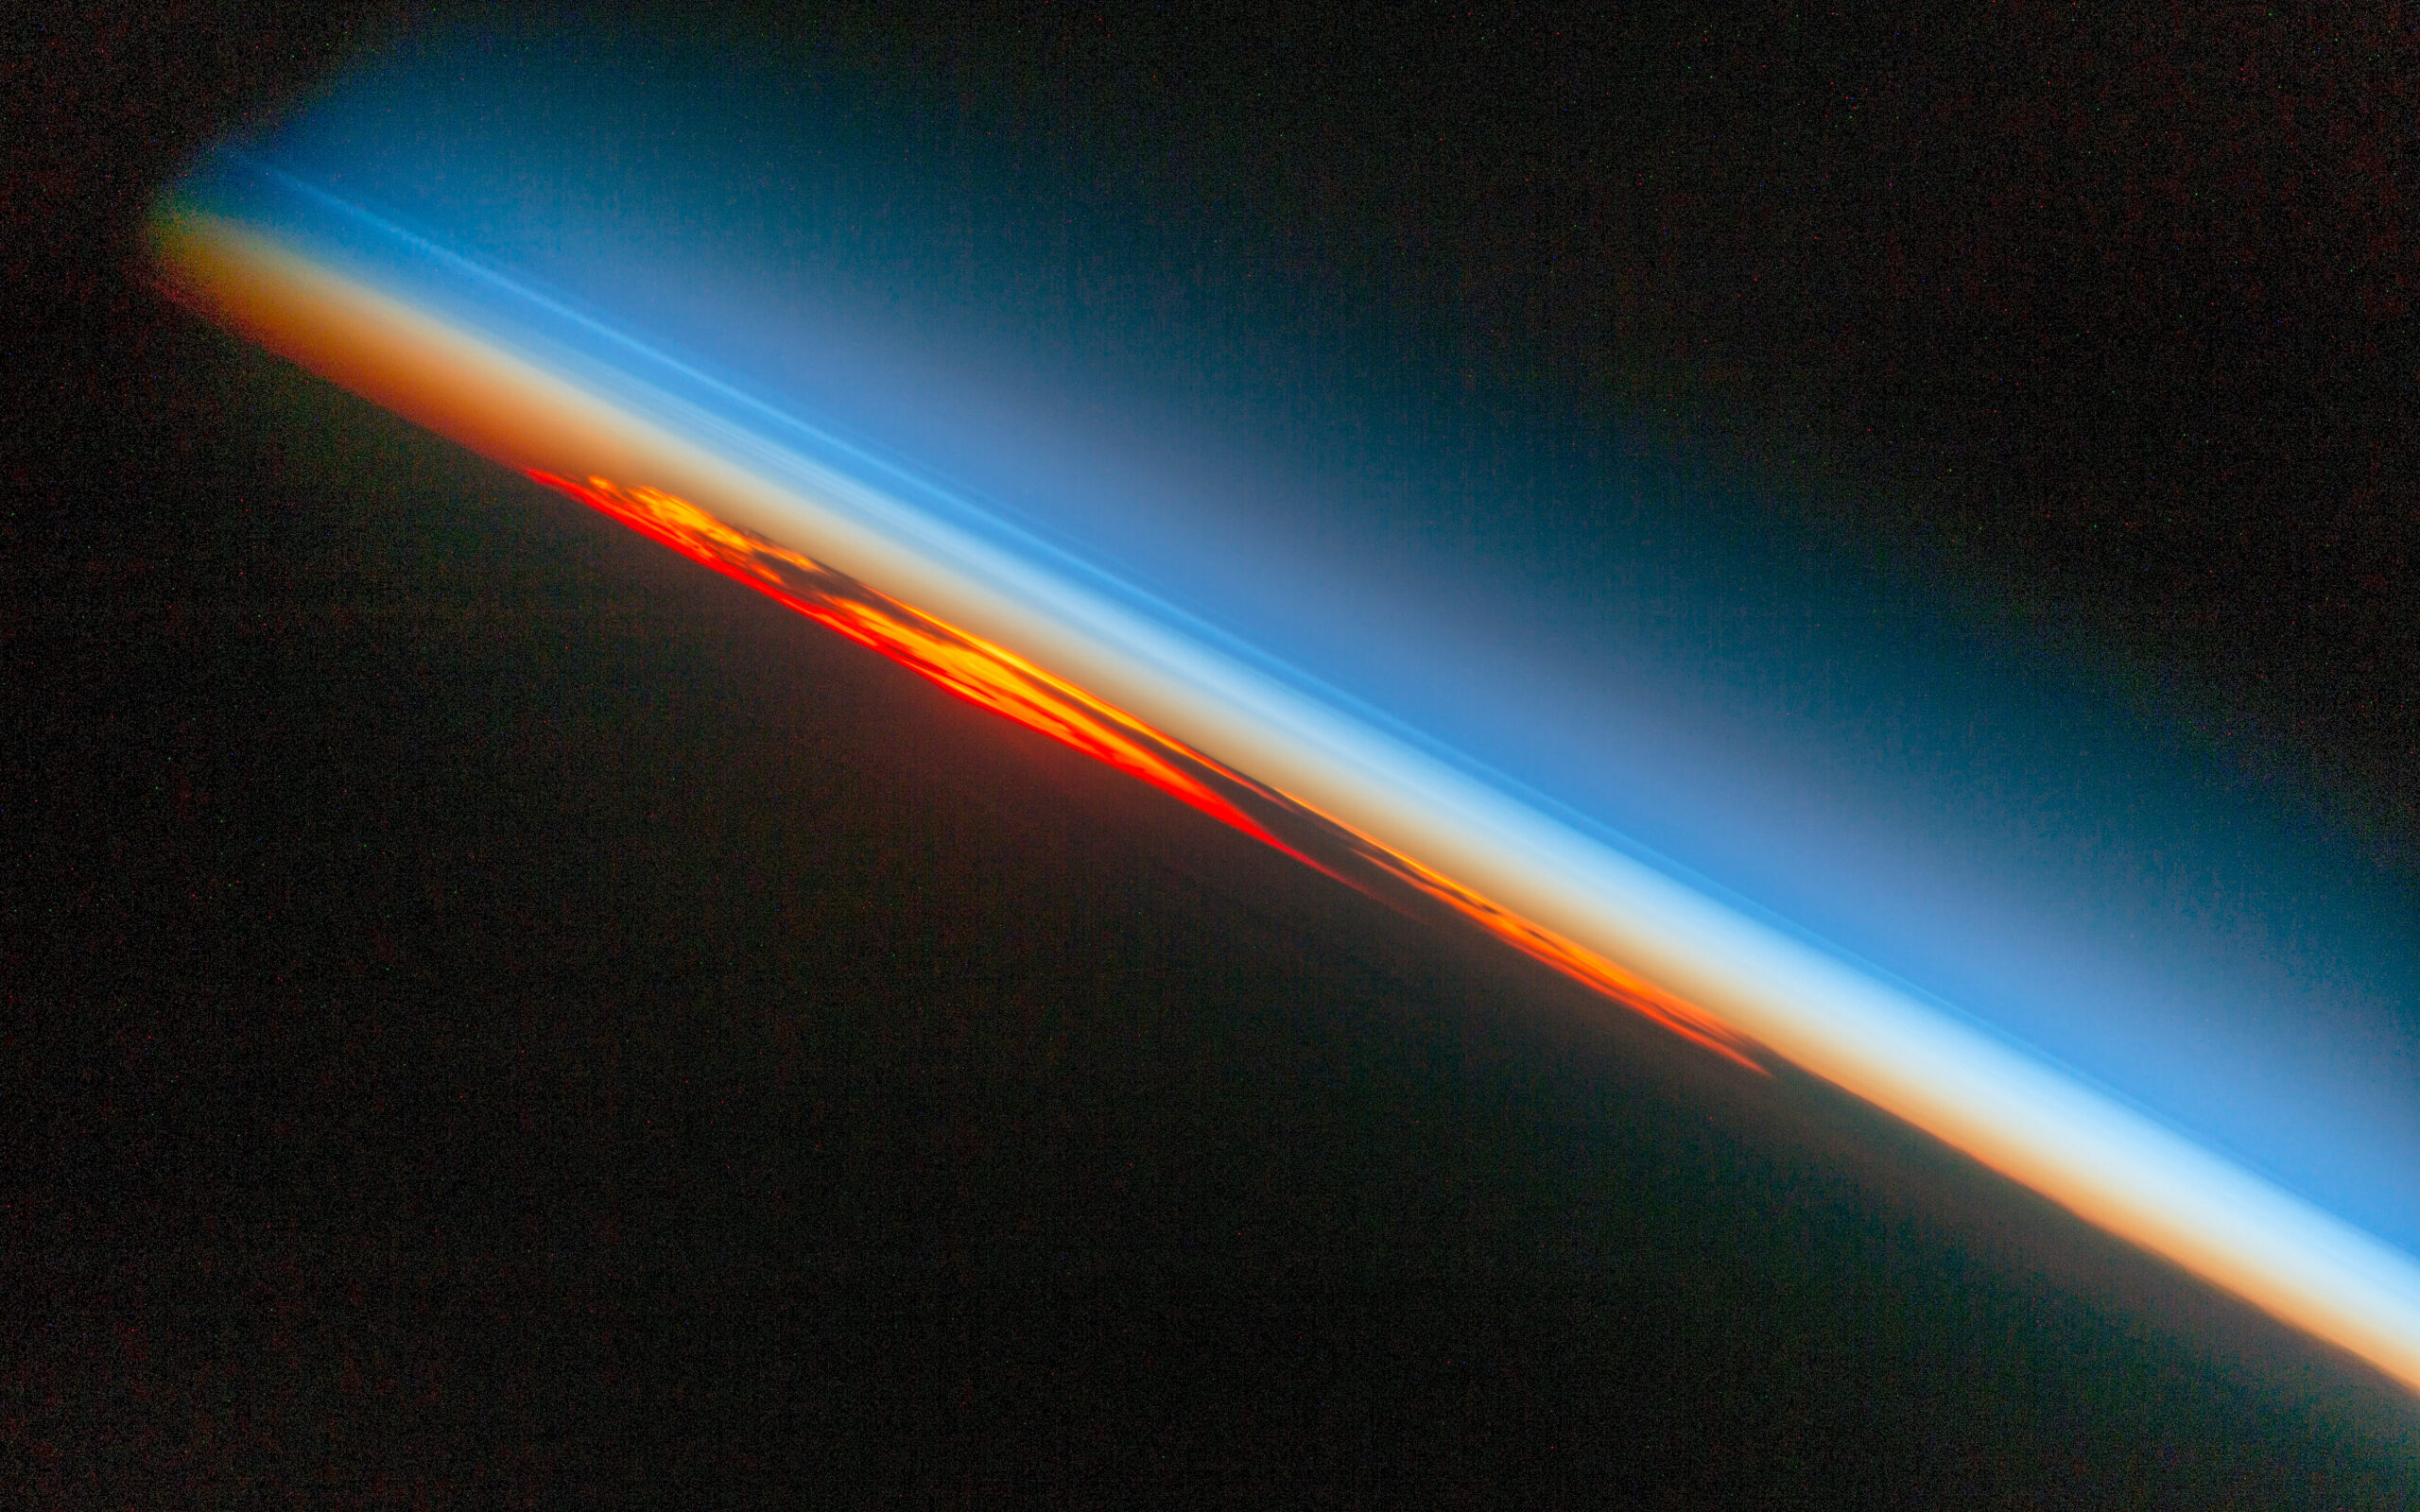
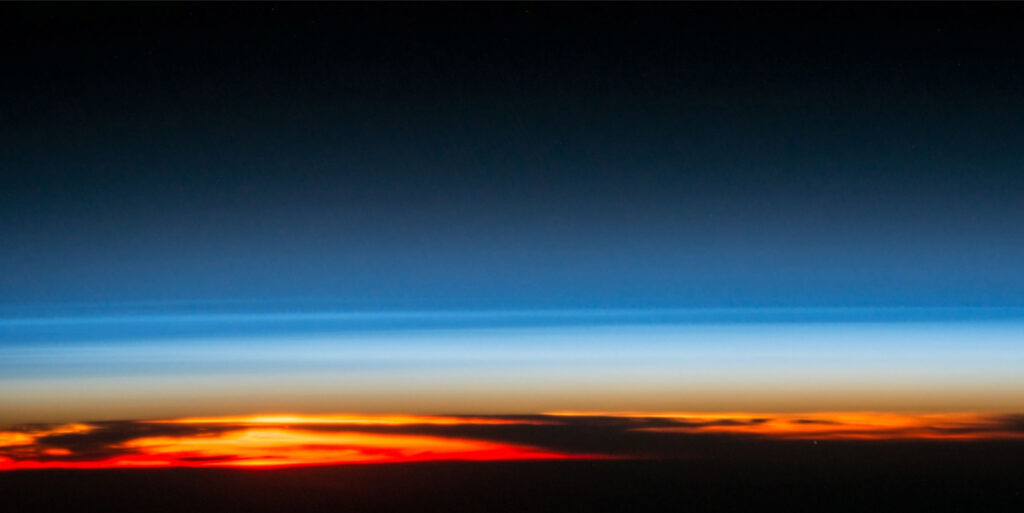
Figure C. ISS photo of Earth’s limb and sky above Patagonia.
Figure C is a photograph of the atmosphere and Earth’s limb over Patagonia on October 27, 2016. This remarkable image was captured by an astronaut of the International Space Station’s Expedition 49 crew while in orbit 400km (250 mi.) over the South Atlantic Ocean.
Look carefully and you’ll see multiple layers just like those that are detected with a twilight photometer. The red and orange layer is the troposphere, brightly colored by dust from the desert below. The tropopause over Patagonia is around 12km (7.5 mi.) high, which means the fuzzy brown, blue, and white layers above the troposphere indicate the stratosphere, which is usually much more uniform in appearance.
Figure D. ImageJ intensity scan of a slice through the atmosphere in Fig. C.
Figure D shows an intensity scan superimposed over a narrow section of the photo in Figure C. This scan was made with ImageJ image analysis software (free from imagej.nih.gov/ij). The estimated scale correction factor on the vertical y axis assumes that the top of the orange-red layer is the tropopause. This means the top of the stratosphere is approximately at the 685 point on the y axis, and this is where the mesosphere begins.
The intensity scan in Figure D clearly shows dust layers in the troposphere and unknown aerosol layers in the stratosphere. Based on my hundreds of twilight photometer scans of the evening sky, even very small undulations suggest the presence of aerosols. Therefore, some of the small bumps in the scan within the mesosphere are probably caused by aerosols too.
Figure E. Twilight photometer scan showing Sahara dust over Texas (July 8, 2020).
Figure E is a twilight photometer profile over my Geronimo Creek Atmospheric Monitoring Station (a field by my office) that shows a thick layer of dust from the Africa’s Sahara Desert. This stuff arrives over my site most summers. My photometers also detect smoke, smog, and even volcanic plumes like the one from Russia’s Raikoke volcano.
Ultra-Low Noise Twilight Photometers
Figure F. Two of the author’s twilight photometers and data loggers have been in active use since 2014.
The Make: columns that describe how to build and use my original LED Twilight Photometer are still valid. I’ve since built two additional twilight photometers with a total of six channels from the red to the near-infrared. Figure F shows them in a plastic ammo box along with their data loggers. Unfortunately, two of the channels produce very noisy data when detecting aerosols in the stratosphere. I’ve since learned that an LED connected to the input of a logarithmic current-to-voltage converter produces exceptionally clean data up to and even exceeding 300km (186 mi.).
Figure G. Advanced DN120 10-decade current-to-voltage converter, configured as a twilight photometer.
The log converter I use is the discontinued Dawn Electronics DN120 10-decade current-to-voltage converter (Figure G). I bought two on eBay for $33 each, not bad for devices that cost more than $700 new. If you cannot find a surplus DN120, a possible substitute is the Analog Devices AD8304 8-decade log converter chip. Several offshore companies sell compact AD8304 breakout boards; I bought two for $25–$30 each.
Figure H. Readily available Analog Devices AD8304 8-decade current-to-voltage converter board atop a data logger and 5.5-volt battery forms a simple LED twilight photometer. The black heat-shrink tube forms a collimator when pressed over the LED.
Figure H shows a quickly assembled twilight photometer made by stacking an AD8304 board atop an Onset 16-bit data logger and a 5.5-volt backup battery designed to charge a mobile phone. While these log converters do not have as much dynamic range as the DN120, preliminary data from two twilight sessions looks good. Testing will resume once the clouds clear out between my site and several hundred miles west.
Conclusion
So far, I’ve accumulated several hundred twilight scans using the two instruments based on my original design in Make: and around a hundred scans using the DN120 current-to-voltage converter. After clear skies return this fall, I’ll add an AD8304 photometer and lengthen the twilight scans to two hours or more to see what happens up to 1,000 km (621 mi.) or more overhead. It’s possible that space debris might reveal itself as brief spikes in the intensity scans. Meanwhile, I’m working on a formal paper about this research.
Forrest M. Mims III (forrestmims.org), an amateur scientist and Rolex Award winner, was named by Discover magazine as one of the “50 Best Brains in Science.” His books have sold more than 7 million copies.