Photo by Adobe Stock – diyanadimitrova
This project appears in Make: Vol. 75. Subscribe today for more great projects delivered right to your mailbox.

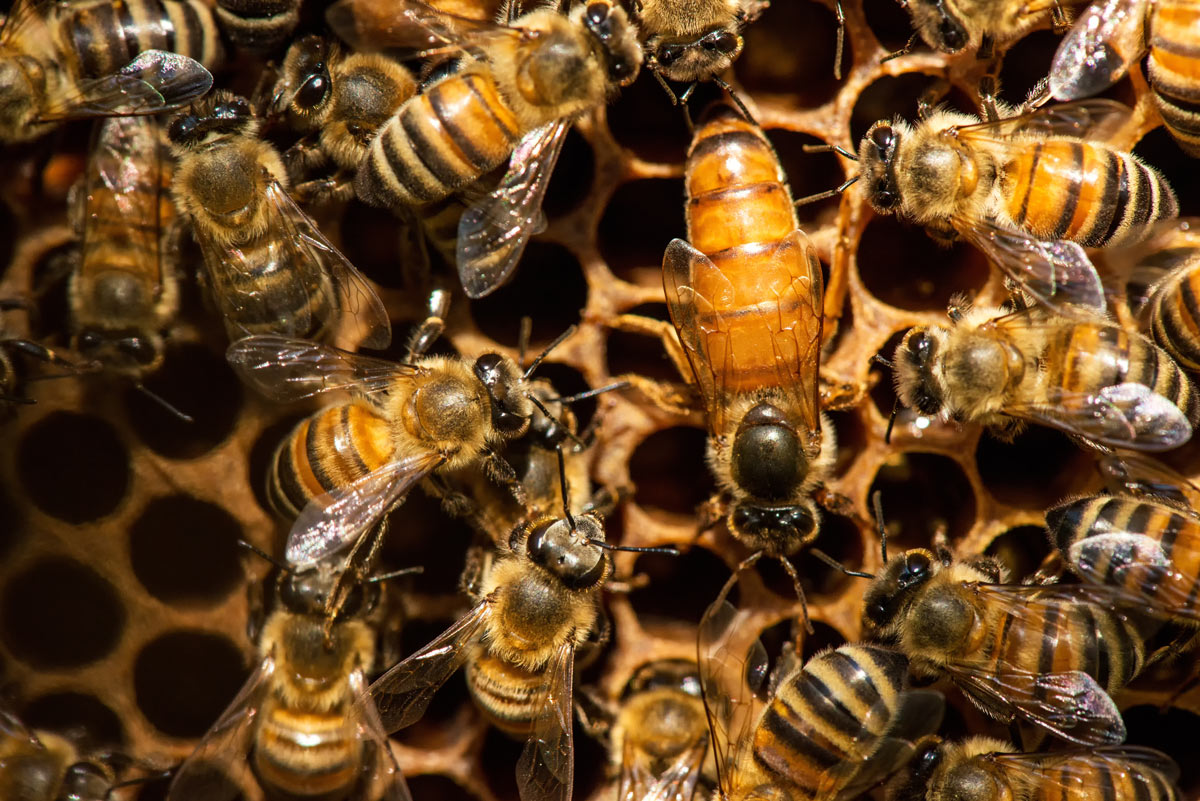
Whether you’re an individual hobbyist or a commercial farmer who relies on large-scale pollination, monitoring your hive with simple sensory data can help beekeepers detect problematic trends in colony health. Our project, known as LongHive, is a full-service infrastructure for beehive maintenance, enabled by deep learning (DL) and LoRaWAN communications via the Helium Network. Data-driven beekeepers can install our LongHive system underneath their standard beehives and take advantage of its suite of sensors, pre-trained convolutional neural network (CNN) for classifying the hive’s acoustic signatures, and web-based dashboard for easy visualization of the transient signals.

Photo by Nathan Pirhalla

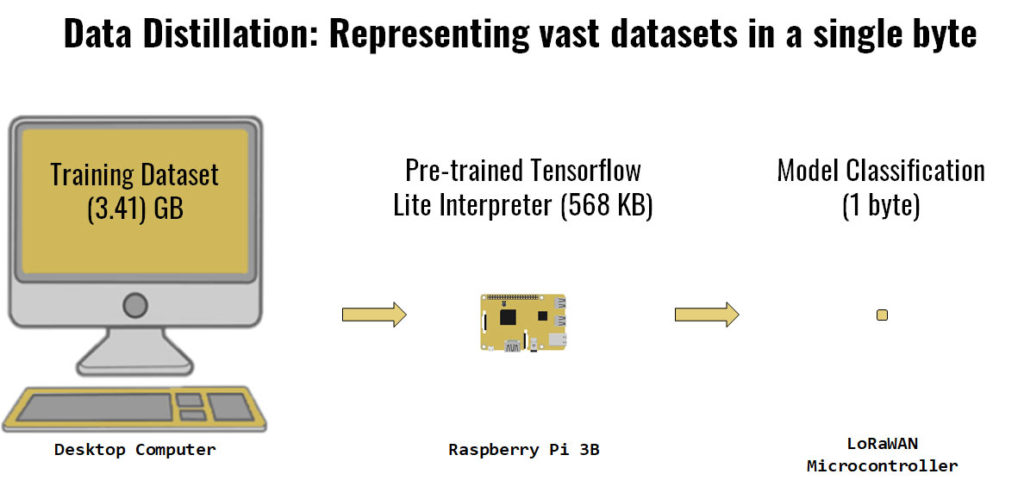
Our goal is to help beekeepers make the most out of their time and reduce the frequency of intrusive hive inspections while still detecting problems within the hive. As opposed to limited-range, power-hungry protocols like Wi-Fi or Bluetooth, the Helium Network’s LongFi architecture enables low-power LoRaWAN devices that can operate in a much more remote environment. We combine edge computing and a pre-trained neural network to circumvent the most glaring constraint of LoRaWAN networks — low transaction throughput — in our DL classifier. A Raspberry Pi bears the computational burden locally, so only the network output (the classification itself) needs to be transmitted over LongFi.

Photo by Nathan Pirhalla

What will the next generation of Make: look like? We’re inviting you to shape the future by investing in Make:. By becoming an investor, you help decide what’s next. The future of Make: is in your hands. Learn More.

Project Steps

LongHive Sensor Suite

In our review of relevant literature and existing commercial solutions, we found a slew of passive sensors that have proven to give some indication of hive health. First and foremost, we want to provide beekeepers with real-time data that they will use to augment their existing heuristics and improve productivity.

Variation in hive weight is a sign of honey production and population.

Temperature is a simple but critical source of information; bees like to keep very precise thermal conditions for optimal hive development. In fact, they have fascinating mechanisms for maintaining this delicate homeostasis: when the hive is too hot, they fan their wings to increase convective cooling; when it’s too cool, they generate heat by vibrating their flight muscles.

Similarly, beekeepers must keep an eye on the relative humidity in their hive — eggs cannot hatch when it’s too dry, but damp conditions can be a sign of mold or disease. 

Carbon dioxide is released into the hive as a byproduct of honey production. Thus, a lack of proper ventilation can result in CO2 poisoning and other maladies. Beekeepers maintain this balance by making tweaks to airflow and insulation.

The acoustic signals emitted by a hive can be a rich source of information, but it will take a more complex processing pipeline to make sense of it (more on this in a moment).

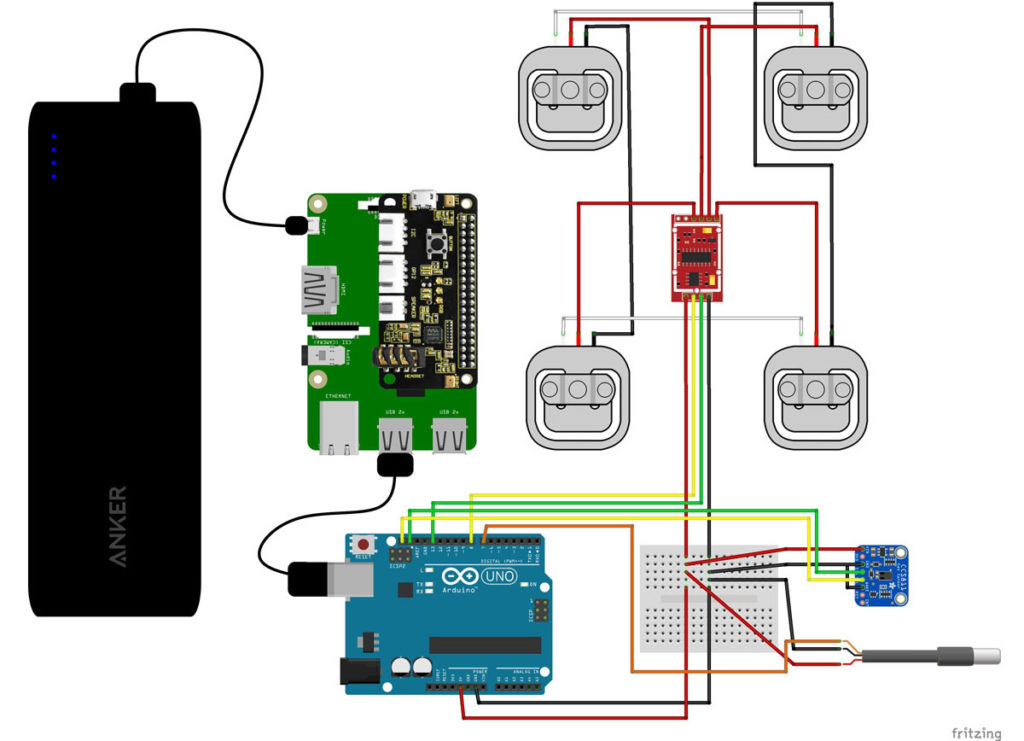
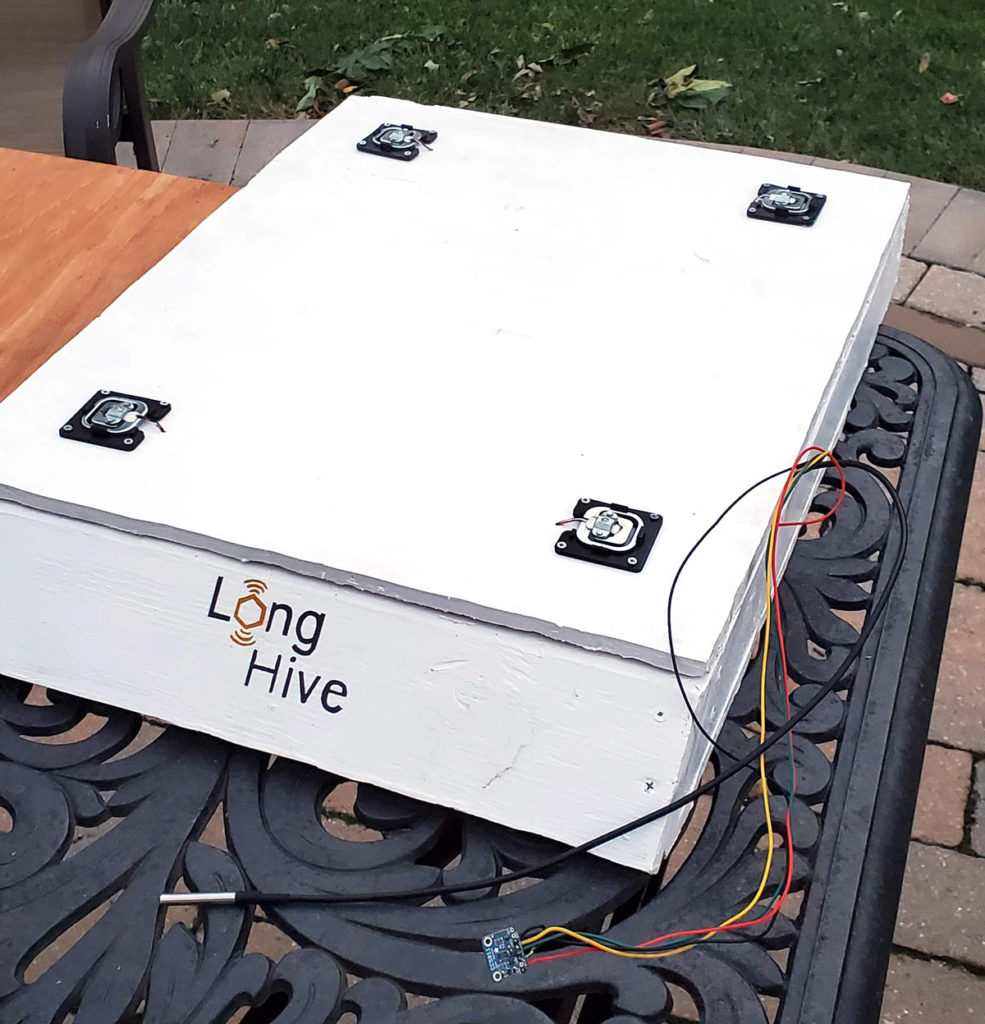
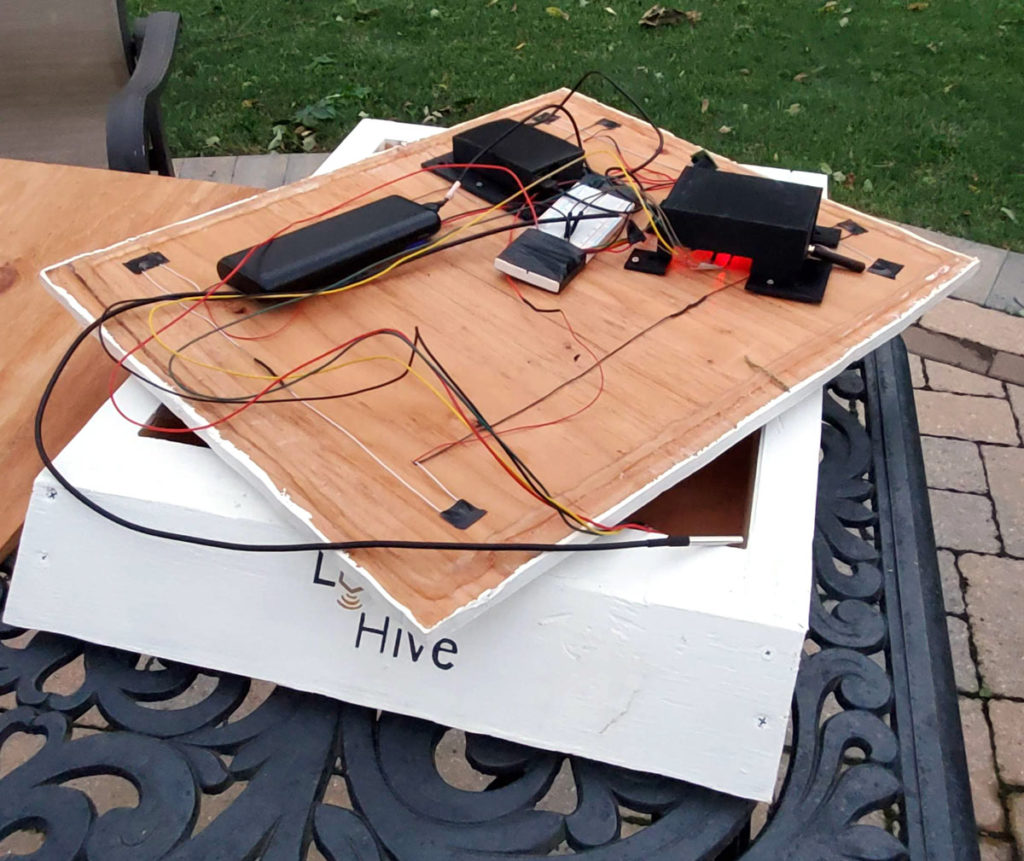
With this ecosystem in mind, we want to be as unobtrusive as possible. The good news is that beehives have standard dimensions, which means we can design a “one size fits all” solution. If you’ve ever seen a hive in person, you’re probably familiar with the famous stackable assembly. After discussing with a friend who keeps bees, we decided to use the empty hive stand at the bottom to house our electronics, batteries, and load cells. Wired sensors are threaded up into the hive to give relevant measurements. 

Classifying Buzzing Signals With Deep Learning

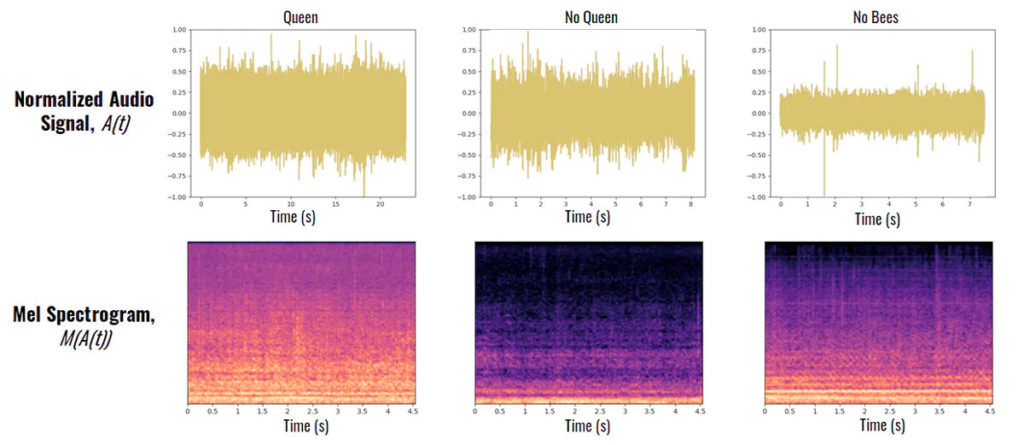
While you can tell a lot about a hive’s health from first-degree data sources like temperature and humidity probes, researchers have proven that you can also extract useful information by listening to the bees themselves. As a proof of concept, we have implemented a CNN that classifies a hive based on whether or not it has a queen, by encoding the spectral content of its acoustic signals. Once a robust, labeled dataset is collected (hopefully through the LongHive community), we suspect that we can use a similar pipeline to make other classifications.

The training dataset was compiled from an open source publication, where beekeepers recorded their hives and labeled the audio files according to whether or not they had a queen. Because it represents a variety of geographic locations, recording techniques, and background noise, the data is robust and generalizable. We split the WAV files into 4.5-second segments, resulting in about 2,000 training samples per class (queen or no queen).

In a purely temporal domain, these acoustic signals are not easily separable, as it is difficult (for a DL model) to differentiate audio of differing amplitudes and background noise. Mel spectrograms are commonly used for audio classification, as they extract relevant spectral information from the time-series signals into an image, allowing us to take advantage of mature CNN-based techniques. The X-axis is time, the Y-axis is frequency, and the color is the power of the signal at that frequency band.

Once the mel spectrograms were cropped and resized to 256×256×3 inputs, they were fed into the CNN. We found network training to be somewhat unstable, likely due to the small and noisy dataset. (For you machine learning fans, the architecture contains about 144,000 trainable parameters — for reference, the groundbreaking AlexNet architecture has over 60 million parameters! — and consists of descending convolutional and max pooling layers with Leaky ReLU activations for feature extraction and two fully connected layers for classification.) We wanted to keep the size as small as possible, in order to run optimally on the Raspberry Pi. The final accuracy for this binary classification (queen/no queen) was 89% on a test set, but as the LongHive community grows, the model will only improve.

Edge Computing and Grafana Dashboard

For real-time model evaluation, it’s computationally inefficient to run a full-blown TensorFlow implementation on the Raspberry Pi, so we’re using ARM-friendly TensorFlow Lite for the classification task. The pre-trained TF model was exported, its architecture and weights converted into .tflite format, and copied to the Pi’s local memory. To collect the audio signals, we’re using the ReSpeaker 2-Mics Pi HAT, which has a well-documented Python library. We’re also using the same exact pre-processing pipeline to generate the mel spectrogram test images as we used for the training data. Saving the recording, calculating the Fourier transforms, and evaluating the model takes about 10 seconds on the Pi. The classification label (1: queen detected, 0: no queen detected) is transmitted to the STM microcontroller board via the serial port at predefined intervals. 

This is edge computing at its finest: we distilled several gigabytes of training data down into a pre-trained 500KB TFLite model that can be loaded into the Pi’s RAM. Upon evaluation, all this knowledge is characterized in the classification by a single byte. LongFi may be known for its low throughput, but that doesn’t mean it can’t represent vast amounts of information.

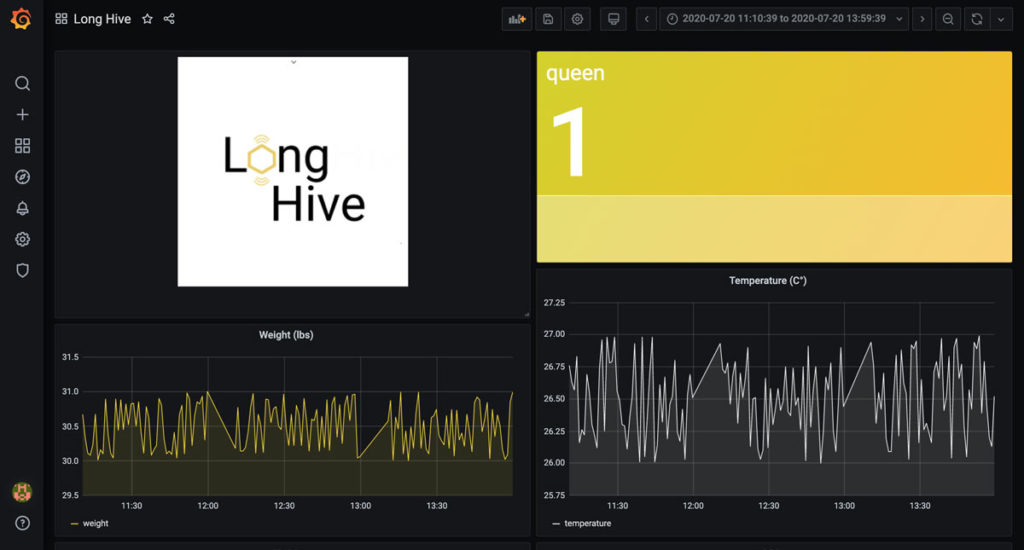
For real-time analysis, the transient sensor data can be viewed from any web browser on our Grafana dashboard. Grafana provides a modular, professional-looking medium for displaying a wide range of data types.

Future Plans

Our project was fortunate enough to win the Grand Prize of the #IoTForGood challenge on Hackster.io. We plan to invest much of our prize winnings into continued development and refinement of our prototype.

This iteration is a viable proof of concept of the potential of the LongHive system, but it’s far from optimal. The Raspberry Pi and LRWAN-1 board will eventually be replaced by specialized hardware with deep sleep capabilities for improved battery life performance. In our prototype, we used a USB battery pack to power the system for three days, but we believe we can increase longevity by several weeks by refining the electronics and code.

Conclusion

Get the code, build files, and even more details from the project page at Hackster.io.

This project appeared in Make: Volume 75. Subscribe today for more great projects delivered right to your mailbox.