

![BITalino (r)evolution BT [blocks]](https://i0.wp.com/makezine.com/wp-content/uploads/2016/08/BITalino-revolution-BT-blocks.png?ssl=1)
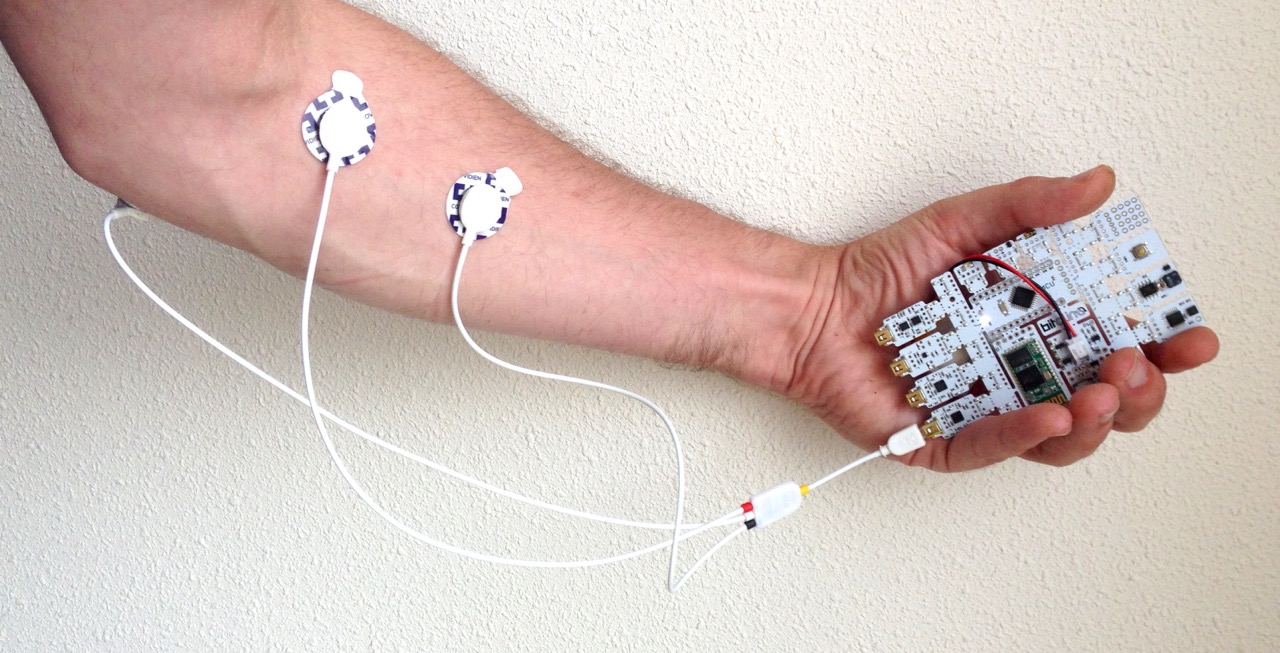
The new BITalino (r)evolution microcontroller board is a welcome upgrade in power and biosensing capabilities. Here are two simple projects to get you started using it. The first is a simple graphing application that lets you visualize your biosignal data, including heart activity (ECG), brain waves (EEG), skin conductance (EDA), and more. The second is a BITalino Pong game that lets you use EMG signals from muscle tension alone to lift the paddle!
I hope you enjoy these — please share any tips or BITalino hacks in the comments at the bottom of this page.
Graphing Your Biosignals with Processing
Although a Java SDK/API is available for the BITalino board, I had little success in getting it to work out of the box with Processing. The Java implementation depends on third-party Bluetooth support (BlueCove), so I chose to develop a sketch from scratch. Well, not completely from scratch. For years I have been using a tiny Processing sketch to visualize signals sent by Arduino (see graphwriter and oscilloscope examples). Nowadays a similar graph writer has been implemented in the Arduino IDE.
To get started, I chose to rewrite this graphwriter sketch to visualize data sent from the BITalino through Bluetooth. Implementation is straightforward, although the Bluetooth implementation of your OS might be different. This sketch was tested on Processing 2.2.1 and 3.0.2 on Mac OSX 10.10.5. (Processing 1.5.1 still works, but the ports are numbered differently.)
In the sketch, you have to adjust the PORTNUMBER (take it from the printed list after the first run).

Linux
Getting the sketch working under Linux requires two extra steps. (I tested it under Ubuntu 14.04 LTS with Processing 2.2.1.) The Bluetooth setup application might have some difficulty pairing with BITalino if you’re not quick enough (just click all buttons in 20 seconds after you’ve turned it on and you’ll be fine, otherwise the setup application will generate its own pairing code and the pairing will fail; see this forum post. Next, you have to bind the paired device to a serial comm port:
edwin@laptop:~$ sudo hcitool scanScanning ...
      20:16:02:26:60:86	BITalino
      7C:7A:91:DF:FD:DF	ubuntu-0
edwin@laptop:~$ sudo rfcomm bind /dev/rfcomm0 20:16:02:26:60:86 1
edwin@laptop:~$ ls -l /dev/rfcomm0
      crw-rw---- 1 root dialout 216, 0 jun  7 13:04 /dev/rfcomm0
You have to make sure the user starting up Processing is a member of the dialout group. The LED on the BITalino will show you when the connection is made and data-transfer has commenced.
Graphwriter example
The following code configures the BITalino to do full frame (all 6 channels) sampling at 10Hz, displaying the data in a graph on screen. The logic (bit/byte shifting) necessary to decode the data frame (and do the checksum) have been adapted from BITalino’s Arduino example code.
Besides showing a real-time plot, the processing sketch allows for storing the data in a comma-separated text file which can be used in a spreadsheet or other tool for further evaluation.
Download the code from this link: GraphwriterBitalino.pde
BITalino Pong
A quick hack of an existing bit of Pong code: use your muscle tension to lift the paddle and smash that (terribly slow) ball back!
Download the code from this link: bitalinoPong.pde
Then plug in your myosensors (EMG) and start twitching your arm to play Pong!