I’m on the volunteer fire dept. in my town and as such, like to keep tabs on when neighboring towns are dispatched. I came up with the idea to make a large map of my area and put an LED in each town that would light up when they get called out. To do this though i would have to find someway to discriminate between towns, and since multiple towns use the same radio frequency, I couldn’t just cross-reference the frequency with the town. Fortunately though every town has a unique tone sent out just prior to the dispatch. It is this tone that i need to look at, process and then match up with its town.

Seeing as this is meant to run constantly , a micro-contoller is the clear choice, and what better than an arduino. Unfortunately, Arduinos don’t have the capability to process a sine wave by themselves, so i needed to give it a little help…

What will the next generation of Make: look like? We’re inviting you to shape the future by investing in Make:. By becoming an investor, you help decide what’s next. The future of Make: is in your hands. Learn More.

Project Steps

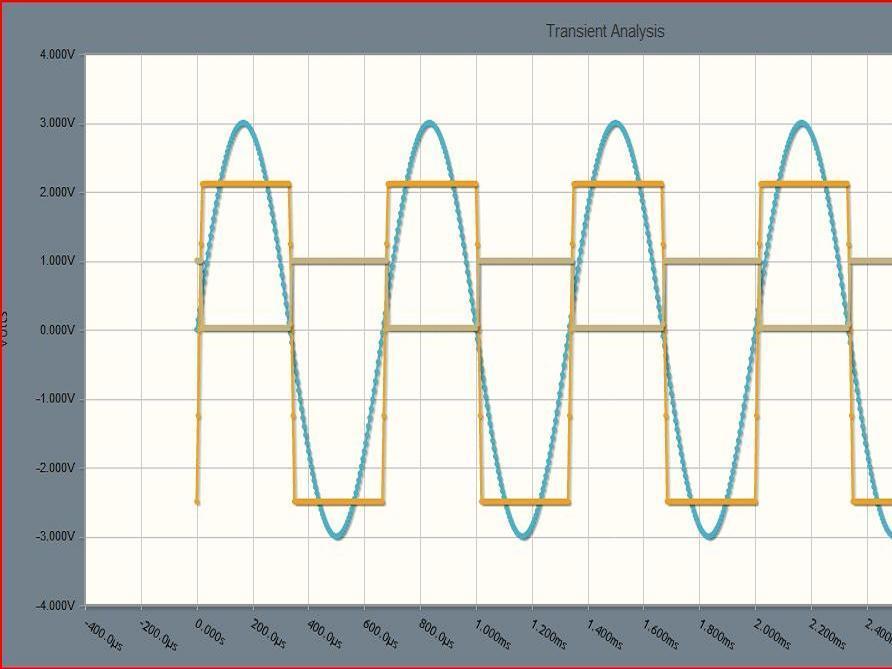
To give the Arduino the capability to process the sine wave, i first converted the sine wave (blue) into a square wave (yellow), and then filtered out any negative voltages. this left a high pulse (tan) every time time the sine wave was negative

This graph was generated using CircuitLab.com ‘s amazing (and free) circuit simulation.

The actual circuit is pretty self explanatory, but I’ll go through it anyways.

You feed the op-amp’s positive with the sine wave, and compare it to a low reference voltage to produce the square wave.

originally i compared the sine wave to ground, but that proved too sensitive and any noise on the line would set it off. A voltage divider such as this one sets a minimum level (in this case volume level).

Once you have the square wave, a simple diode will filter out the negative voltages, leaving just high pulses.

sending the high pulses to the base of a transistor will draw the connector, and the arduino pin it is connected to, to ground.

Not shown here is a ‘pull up’ resistor connected between the arduino’s pin and +5v. this ensures that the pin is always ‘HIGH’ unless we WANT it to be ‘LOW’

Circuit diagram is also from Circuitlab.com

Unfortunately I didn’t have the foresight to take any pictures of it breadboarded but this how my perf-board came out.

The LED is connected between the collector and +5v through a 470 ohm resistor. it lights up with every high pulse off the op-amp and also serves as a pull up for the arduino pin.

Obviously 750 times a second is too fast for us to see, so it just looks like it is lit up. Its a good indicator for when the level clears the reference voltage.

Now that we have ‘low pulses’ (drawing the arduino’s pin to ground) it’s just a matter of coding.

After some research i found the ‘AttachInterupt’ command. details are here: http://arduino.cc/en/Reference/AttachInt…

The basic premise of my code is to find how long it take for 100 pulses to ‘fire’. then you can do some math to find the period of the sine wave and from there it is pretty simple to find the frequency.

The code is attached in a .pdf file. For the most part the coding is complete. To add new towns all you have to do is add their information into the 3 arrays.

Make sure that for the three arrays, each town has its own index. I.E. ‘Windsor’ gets index 0 for frequency index 0, for name, and index 0 for LEDpin.