This project walks you through the steps to download and install a program to analyze rocket data collected from flying a SensorTag on a model rocket. You’ll find out the G forces on the rocket, how fast it went, how high it went, and see the rotation and air pressure during the flight.

Here’s a link to the Maker project to built the ST-2 rocket that carried the iPhone in the movie. Build this rocket to collect your own data to analyze following the steps in this project.

You don’t need to know how to program to follow this project. You get the complete source code, though, so if you do know a little programming, you can tinker with the analysis program to learn even more.

What will the next generation of Make: look like? We’re inviting you to shape the future by investing in Make:. By becoming an investor, you help decide what’s next. The future of Make: is in your hands. Learn More.

Project Steps

Download the software and our sample files from here.

If your O/S doesn’t do it automatically, unpack the zip file.

The software will work on both the iPhone and iPad.

Copy the contents of the file Analysis.bas and paste it into an otherwise empty email. Mail this to yourself.

If you are using techBASIC 2.3, use the file Analysis 2.3.bas instead of the file Analysis.bas.

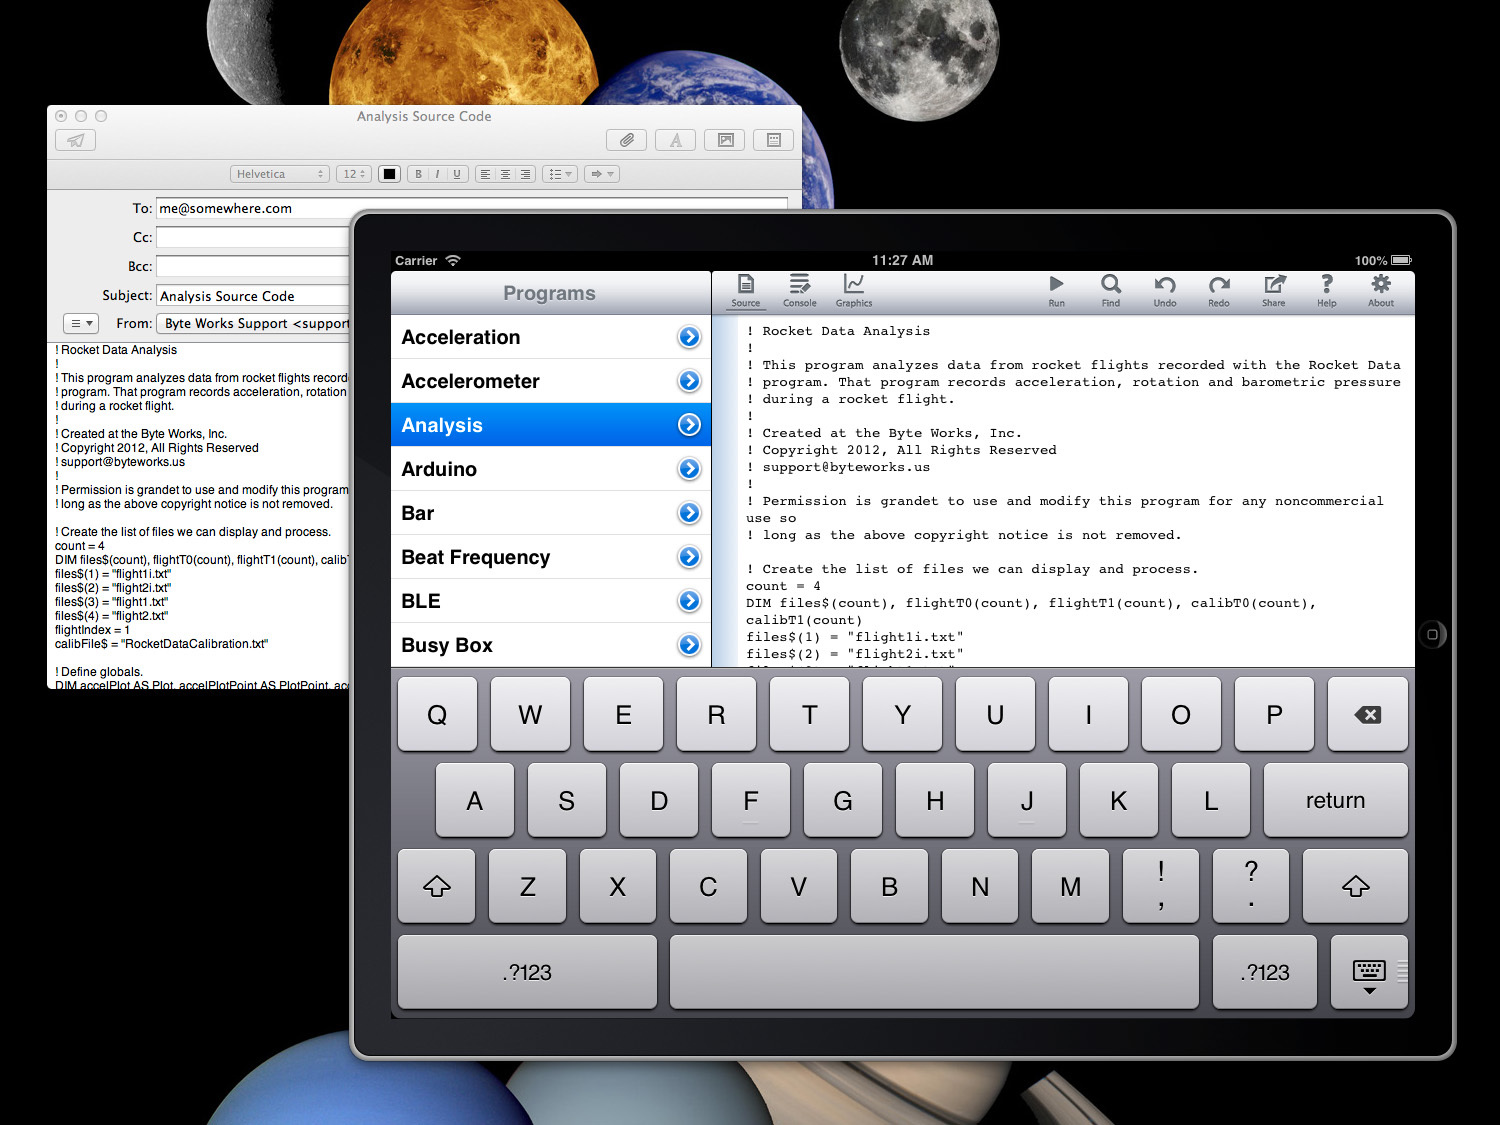
From your iPhone or iPad, copy the contents of the email by tapping twice, then tapping Select All, then tapping Copy.

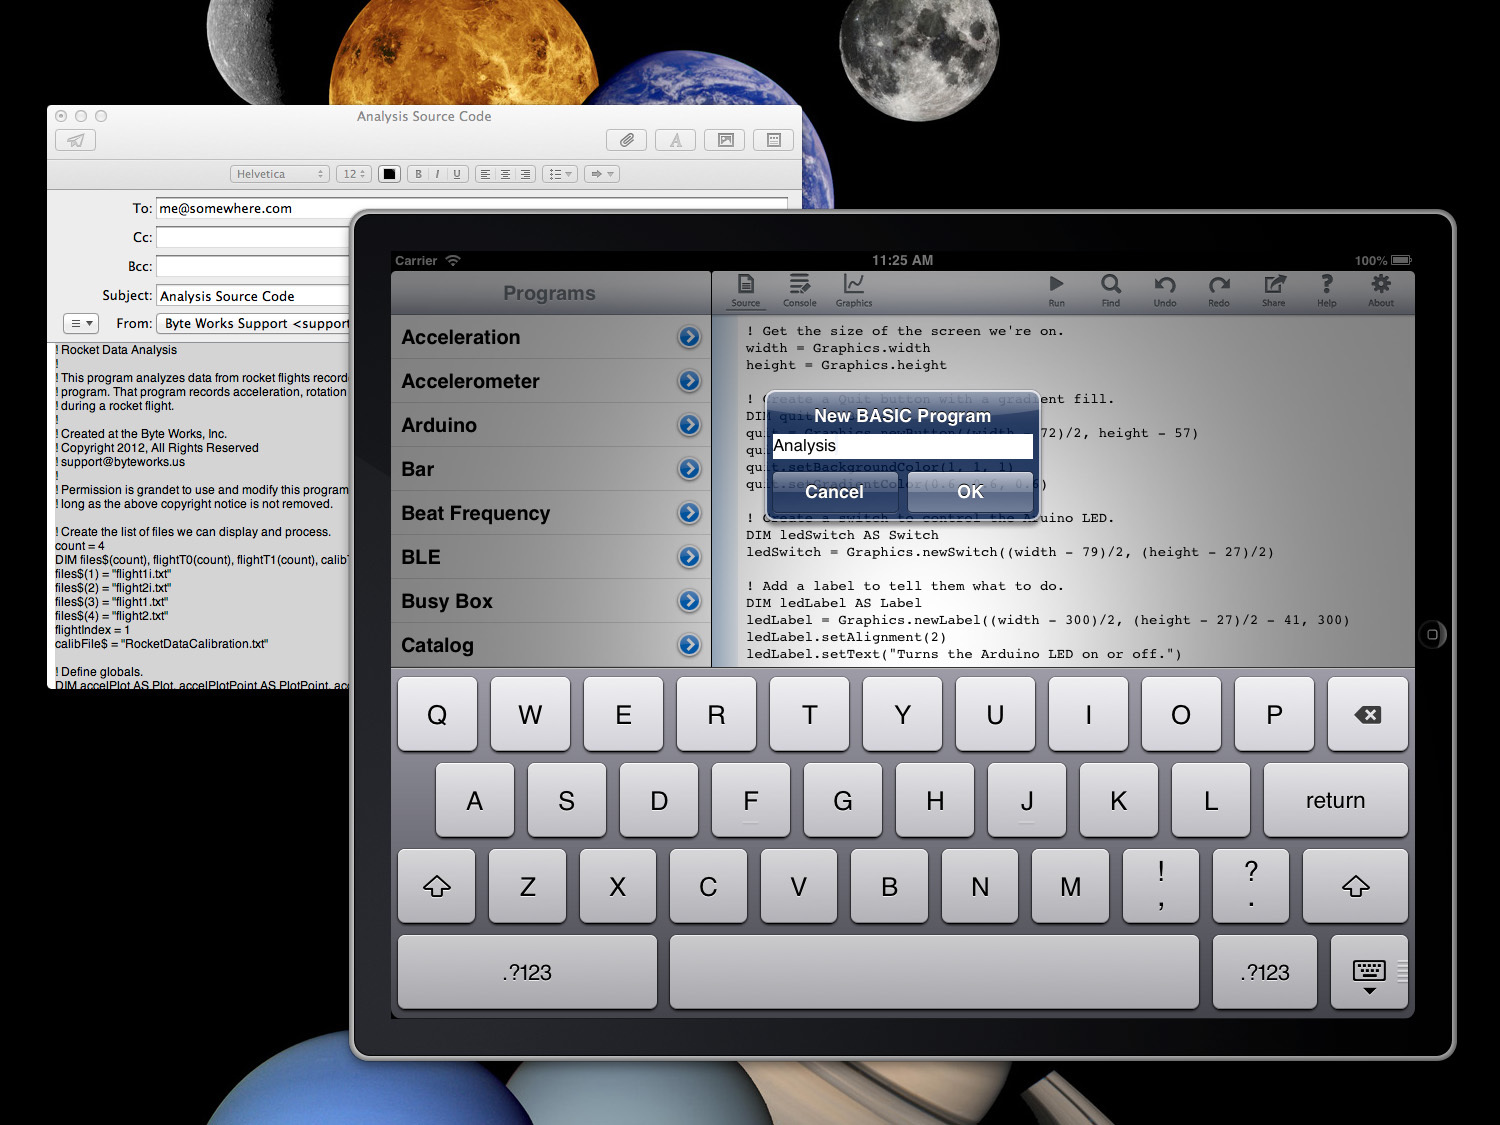
Create a new program.

iPhone/iPod: From techBASIC’s Programs tab, tap New to create a new program. Use the name Analysis.

iPad: Tap the New button as the bottom of the Programs list to create a new program.

Paste the program into the newly created empty file by tapping the screen and then tapping the Paste button.

Copy my data files to techBASIC to get started.

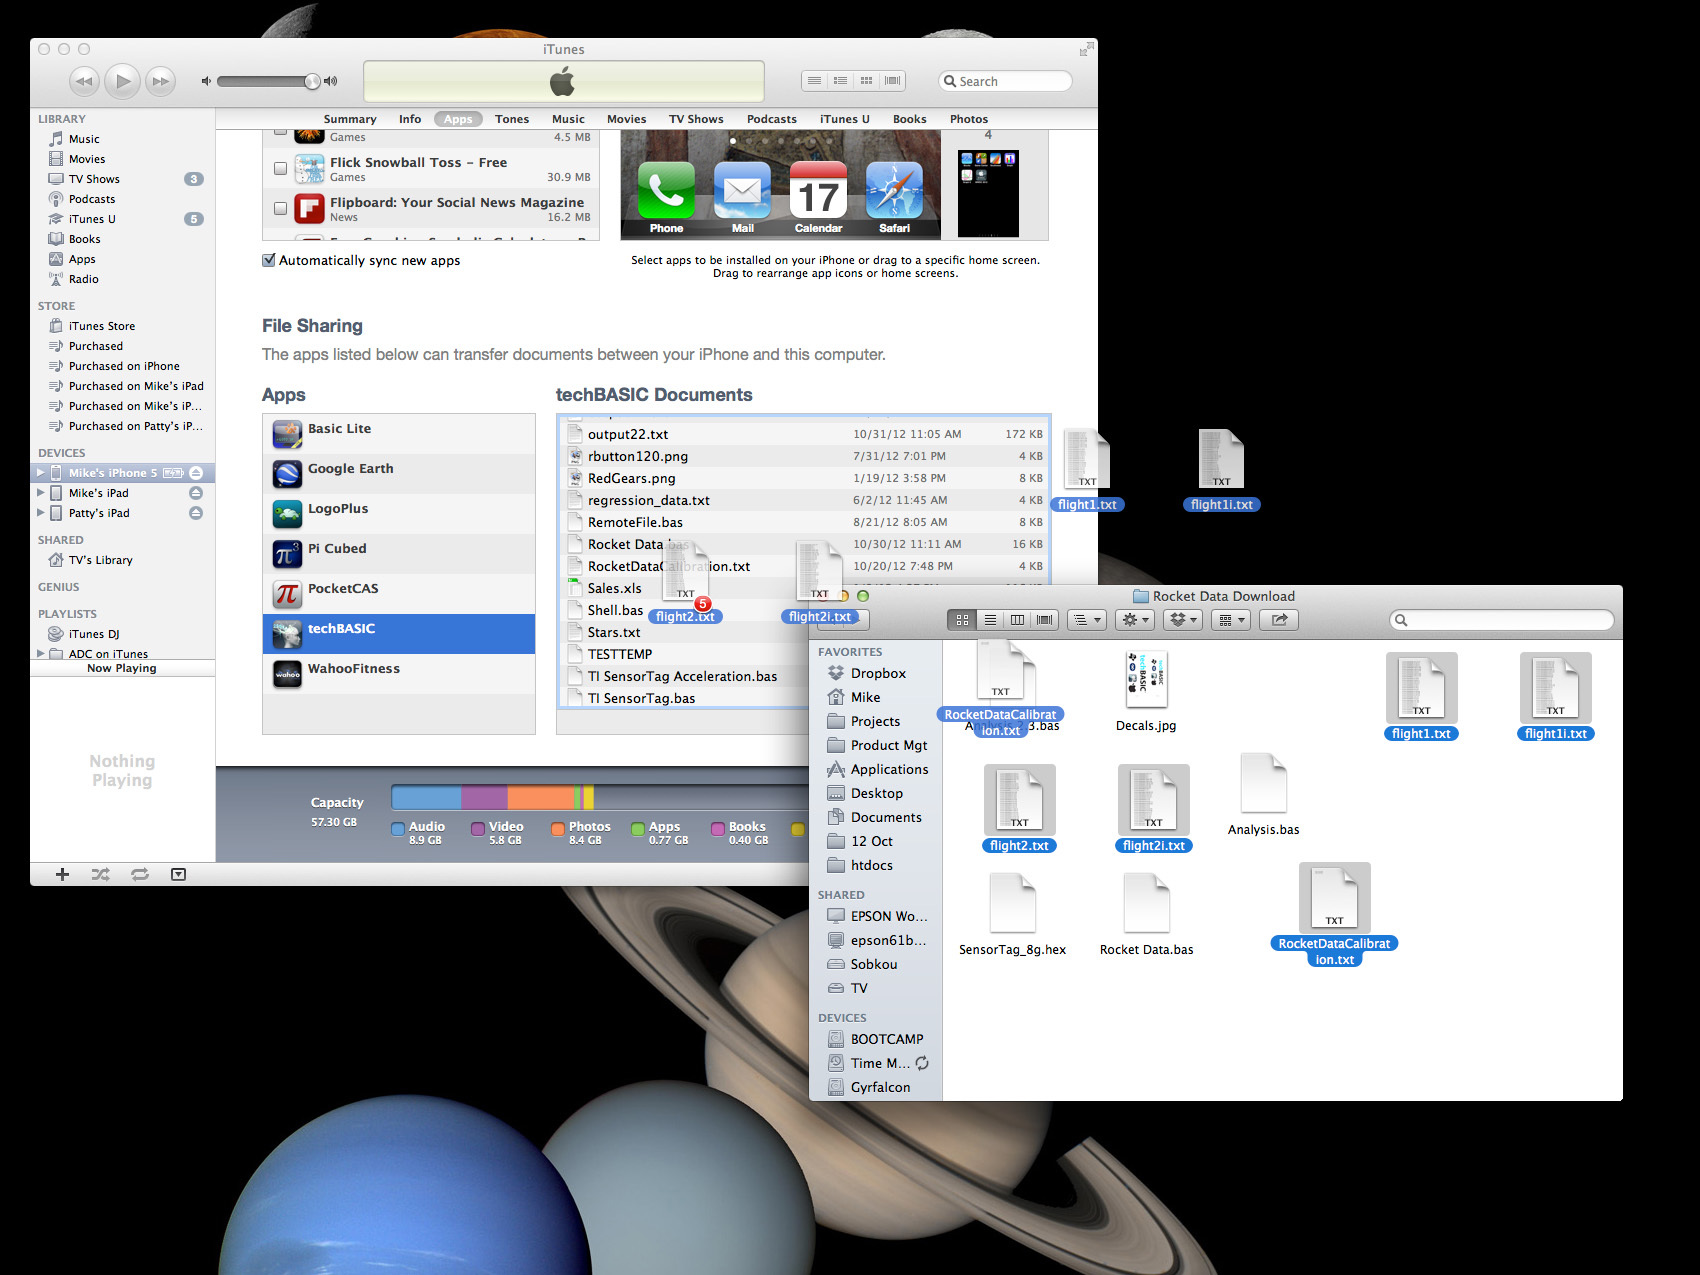
Connect your iPhone or iPad to your computer.

Run iTunes.

Select your device from Devices.

Select Apps from the top menu.

Scroll down and select techBASIC.

Drag the data files to the techBASIC Documents list: flight1.txt, flight1i.txt, flight2.txt, flight2i.txt, RocketDataCalibration.txt.

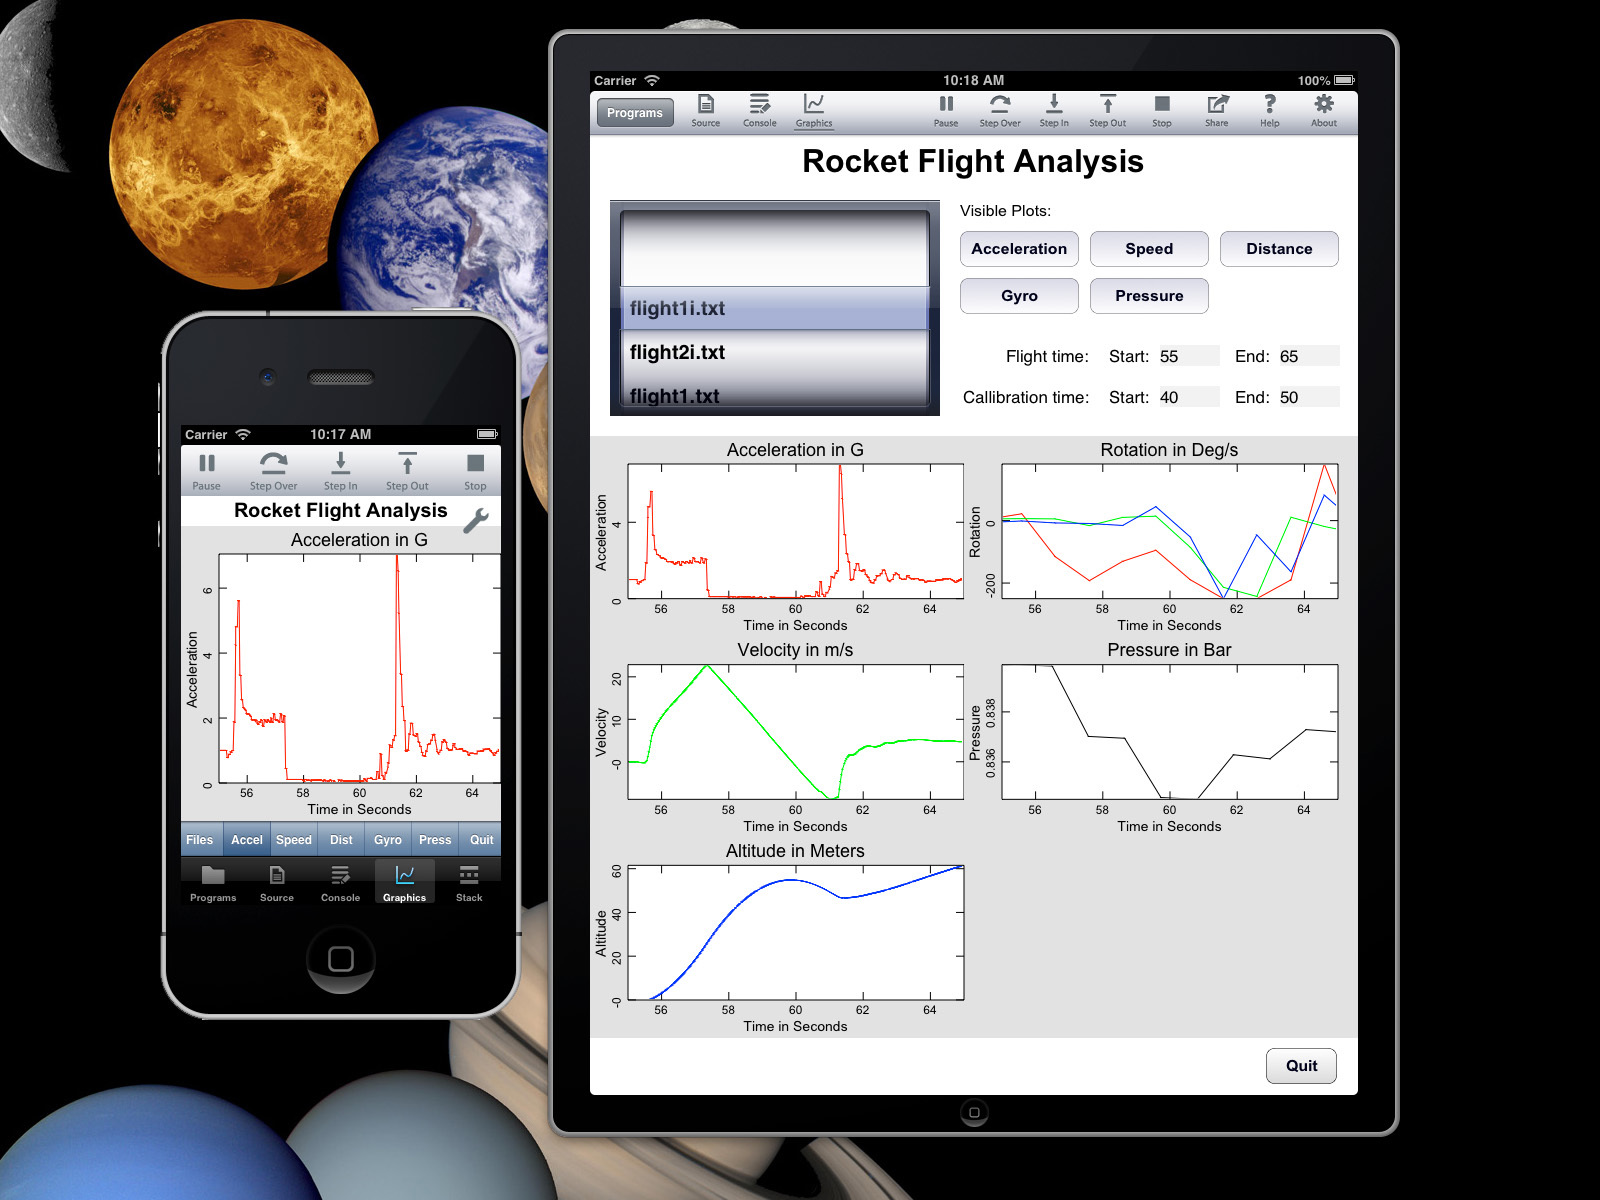
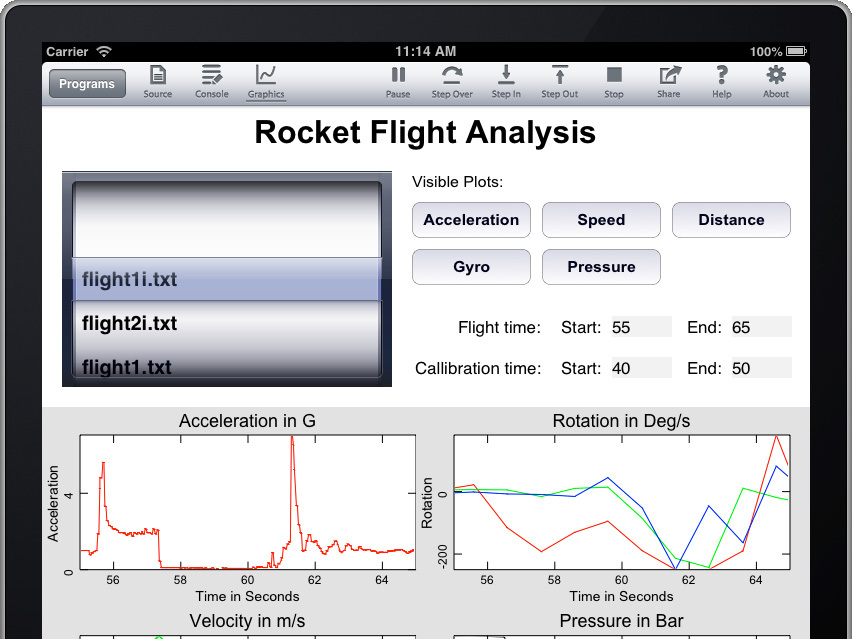
The picker lets you select from any available rocket data. It is showing four data files from our rocket flights. Tap a different flight to see its data.

The five buttons at the right let you show or hide the five available plots.

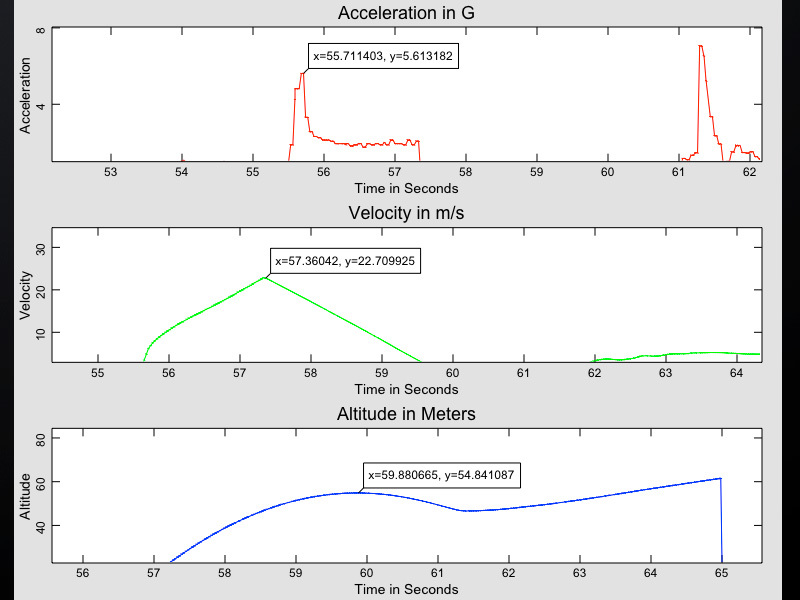
Tap on a plot to see the numeric value at any specific point.

Slide the plots around, use pinch gestures to expand or shrink the plots, or tap to see specific values.

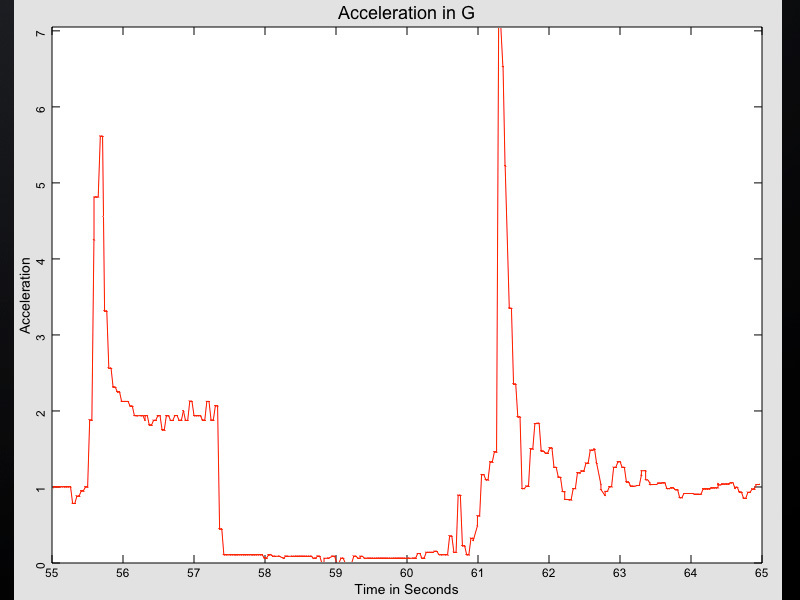
Lift off was at about 55.5 seconds into the data.

Maximum acceleration from the rocket engine was 5.6G, about 0.2 seconds after lift off.

Maximum velocity was 22.7 meters/second (51 miles per hour), and occurred about 2 seconds after lift off.

Maximum altitude was 54.8 meters (180 feet). This occurred after the rocket coasted for a couple of seconds.

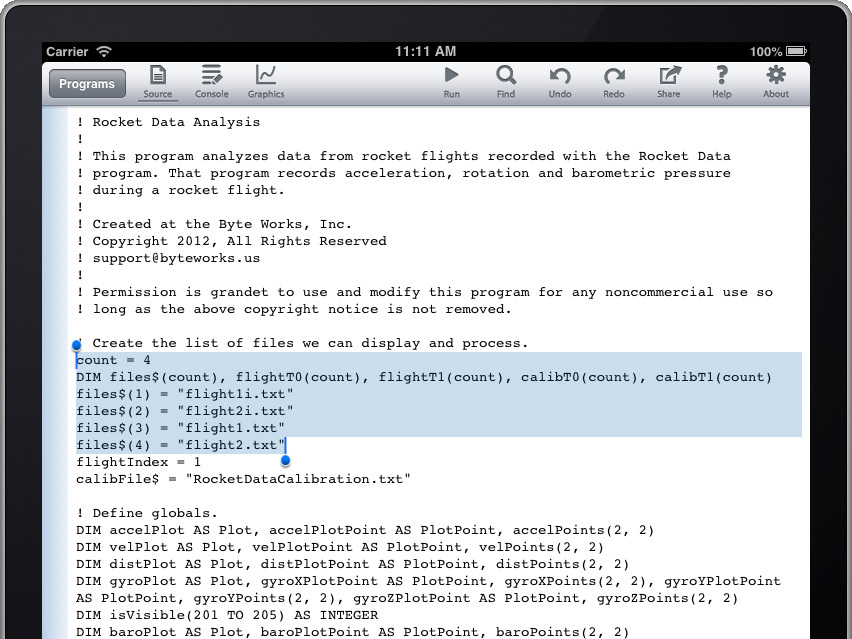
Edit these lines near the start of the program to add your own data.

Change the value of count to the number of data files the program will list.

Add any new files by adding another line to set a value in the files$ array. Increment the number in parenthesis by one for each new file. Remember that file names are case-sensitive in iOS.

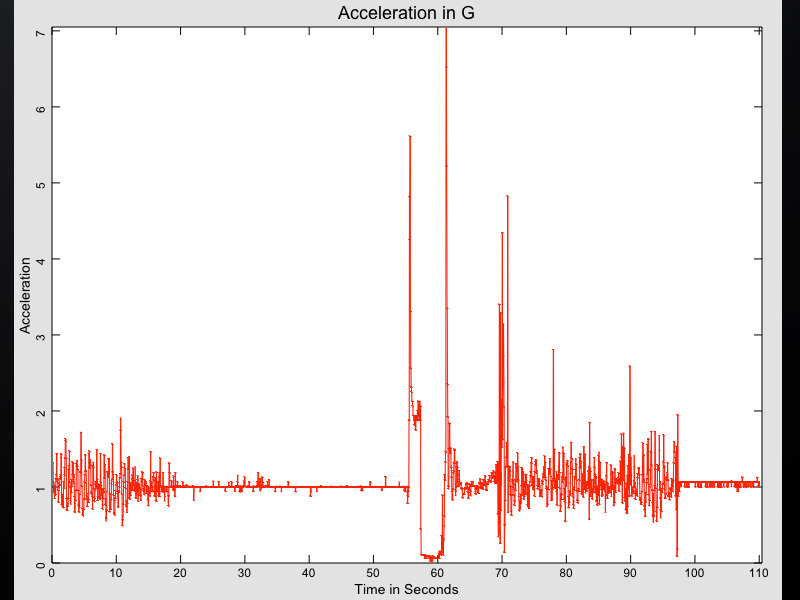
The raw data will have a lot of extraneous information, as well as some valuable calibration information.

Find the start and end of the rocket flight. Enter the times in the Flight time fields. The plot will expand to show just the rocket flight.

Improve the accuracy by calibrating the device.

Sitting on the pad, the accelerometer should measure 1G.

Select about 10 seconds of data before the launch. Enter the times in the Calibration time fields to mathematically calibrate the sensor to 1G.

There’s a story behind the data, as well as some important caveats about errors. See the Rocket Data Analysis portion of this blog if you would like to learn more about how the calculations are done and how reliable they are.

See this blog if you would like to learn more about creating user interfaces in techBASIC. This is what you need to know to modify the controls you see in the program.

See this blog to learn more about using plots and graphics in techBASIC. This tells you how to change and create plots like the five used in this program.

See this blog to explore how data is actually collected from Bluetooth low energy devices like the Texas Instruments SensorTag.