diyspaceweek_1_jbr2-short

Hi-Res Spectrograph

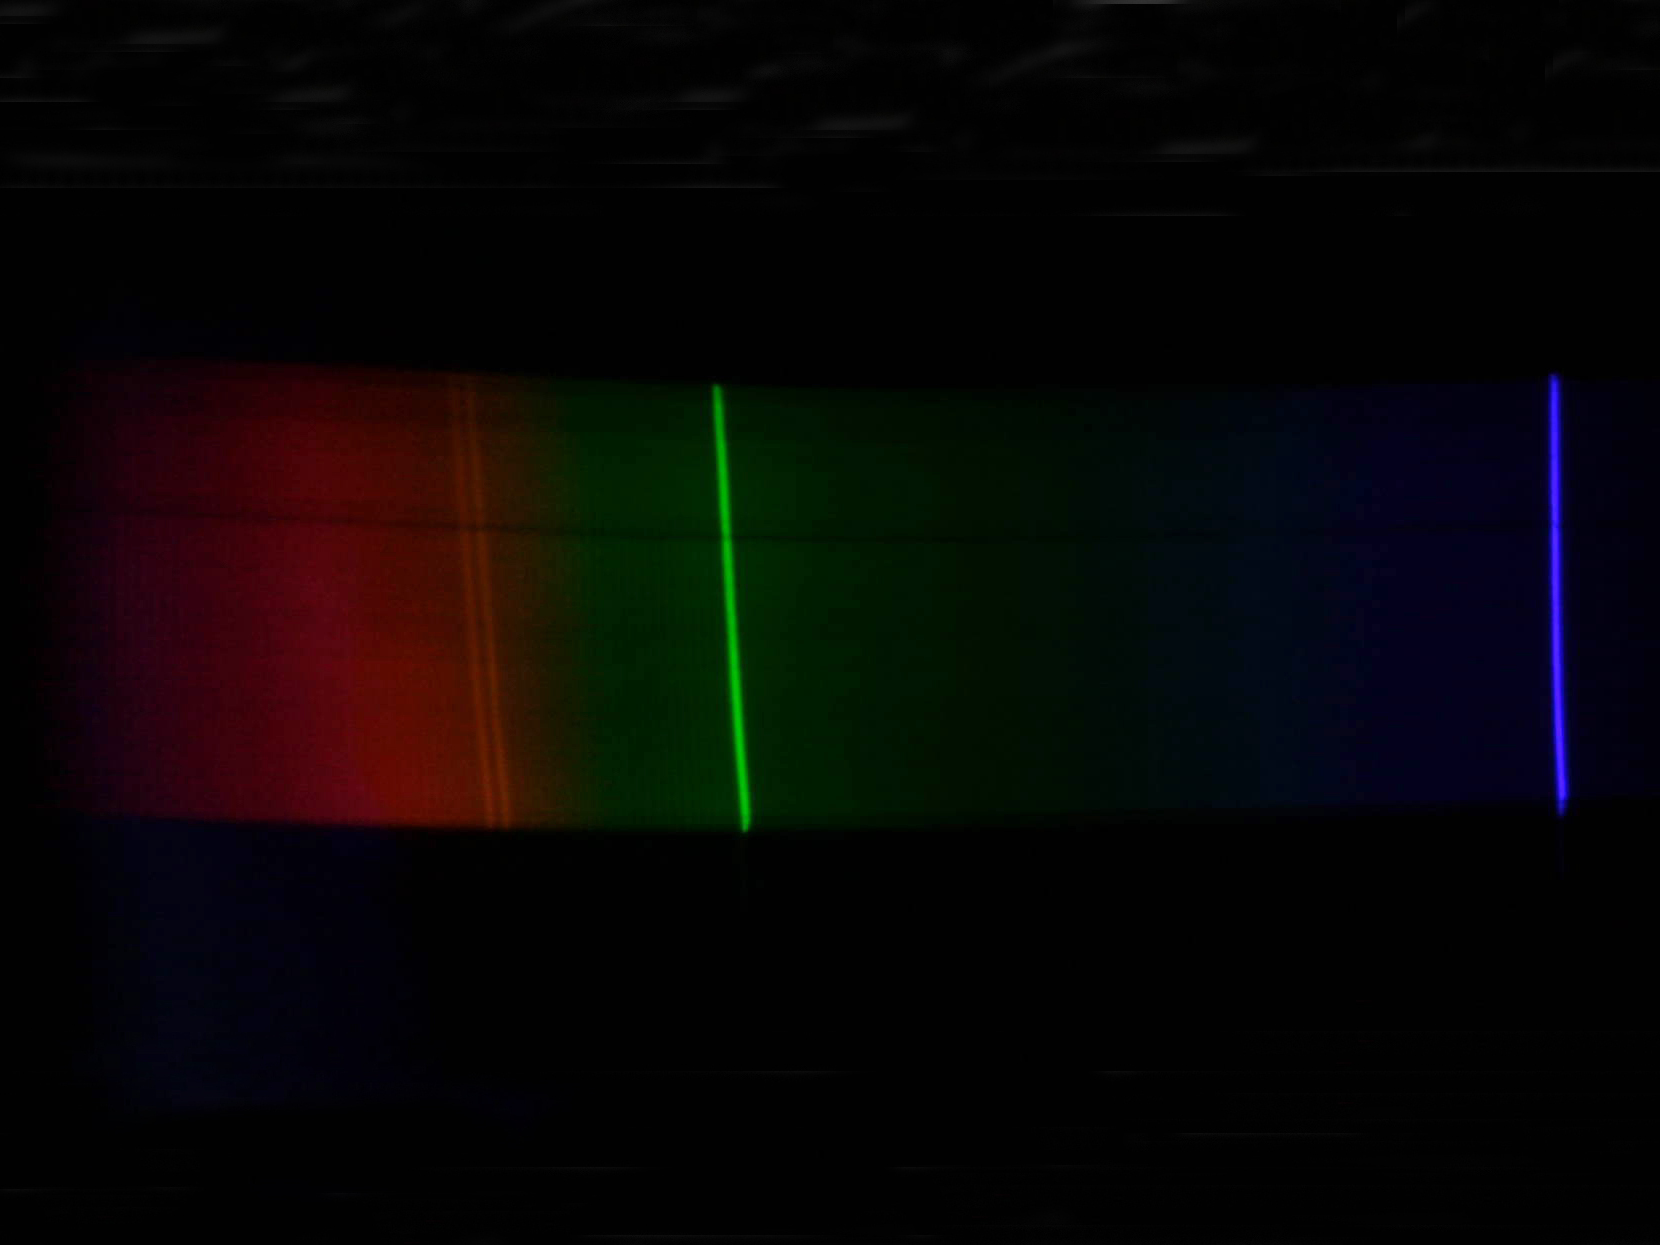
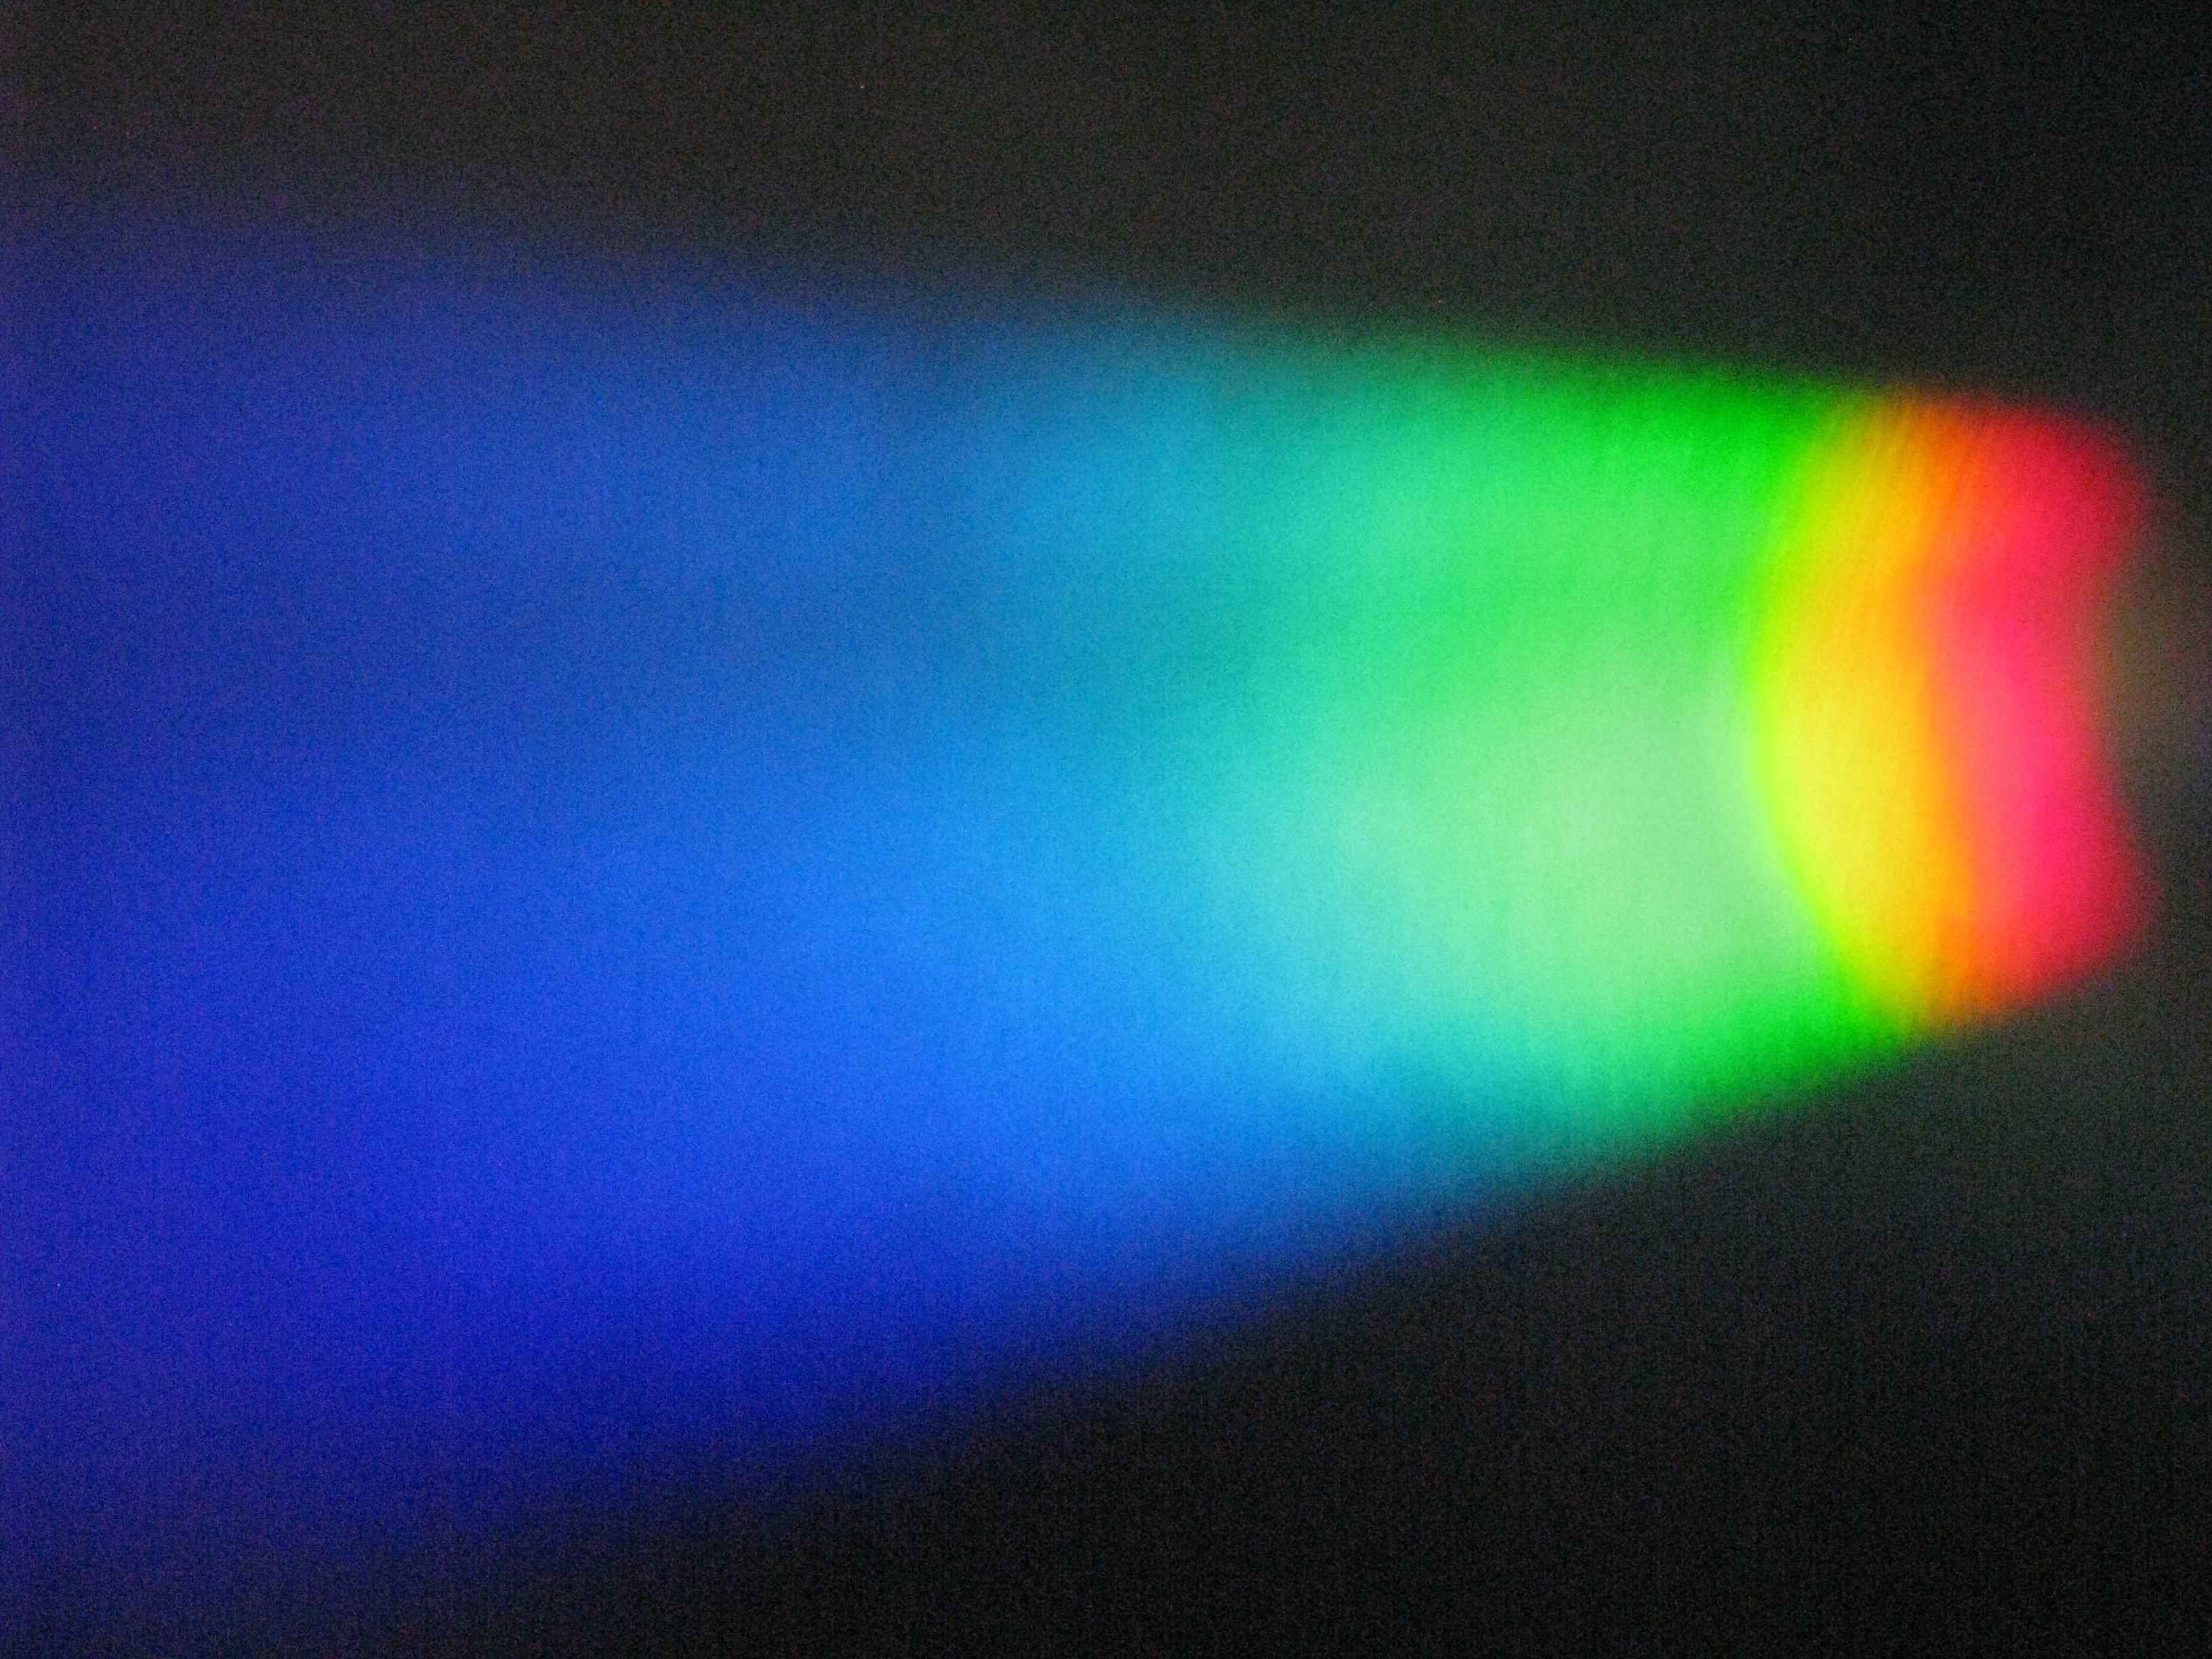
Nearly 200 years ago, Joseph von Fraunhofer built the first spectroscope and saw dark lines in the spectrum of the sun. This led him to discover that you can determine the chemical elements in things by analyzing the light they give off. Each element has its own “signature” of lines in the light spectrum. The lines correspond to the characteristic wavelengths that electrons absorb and emit as they jump between lower- and higher-energy orbits around the atom’s nucleus.

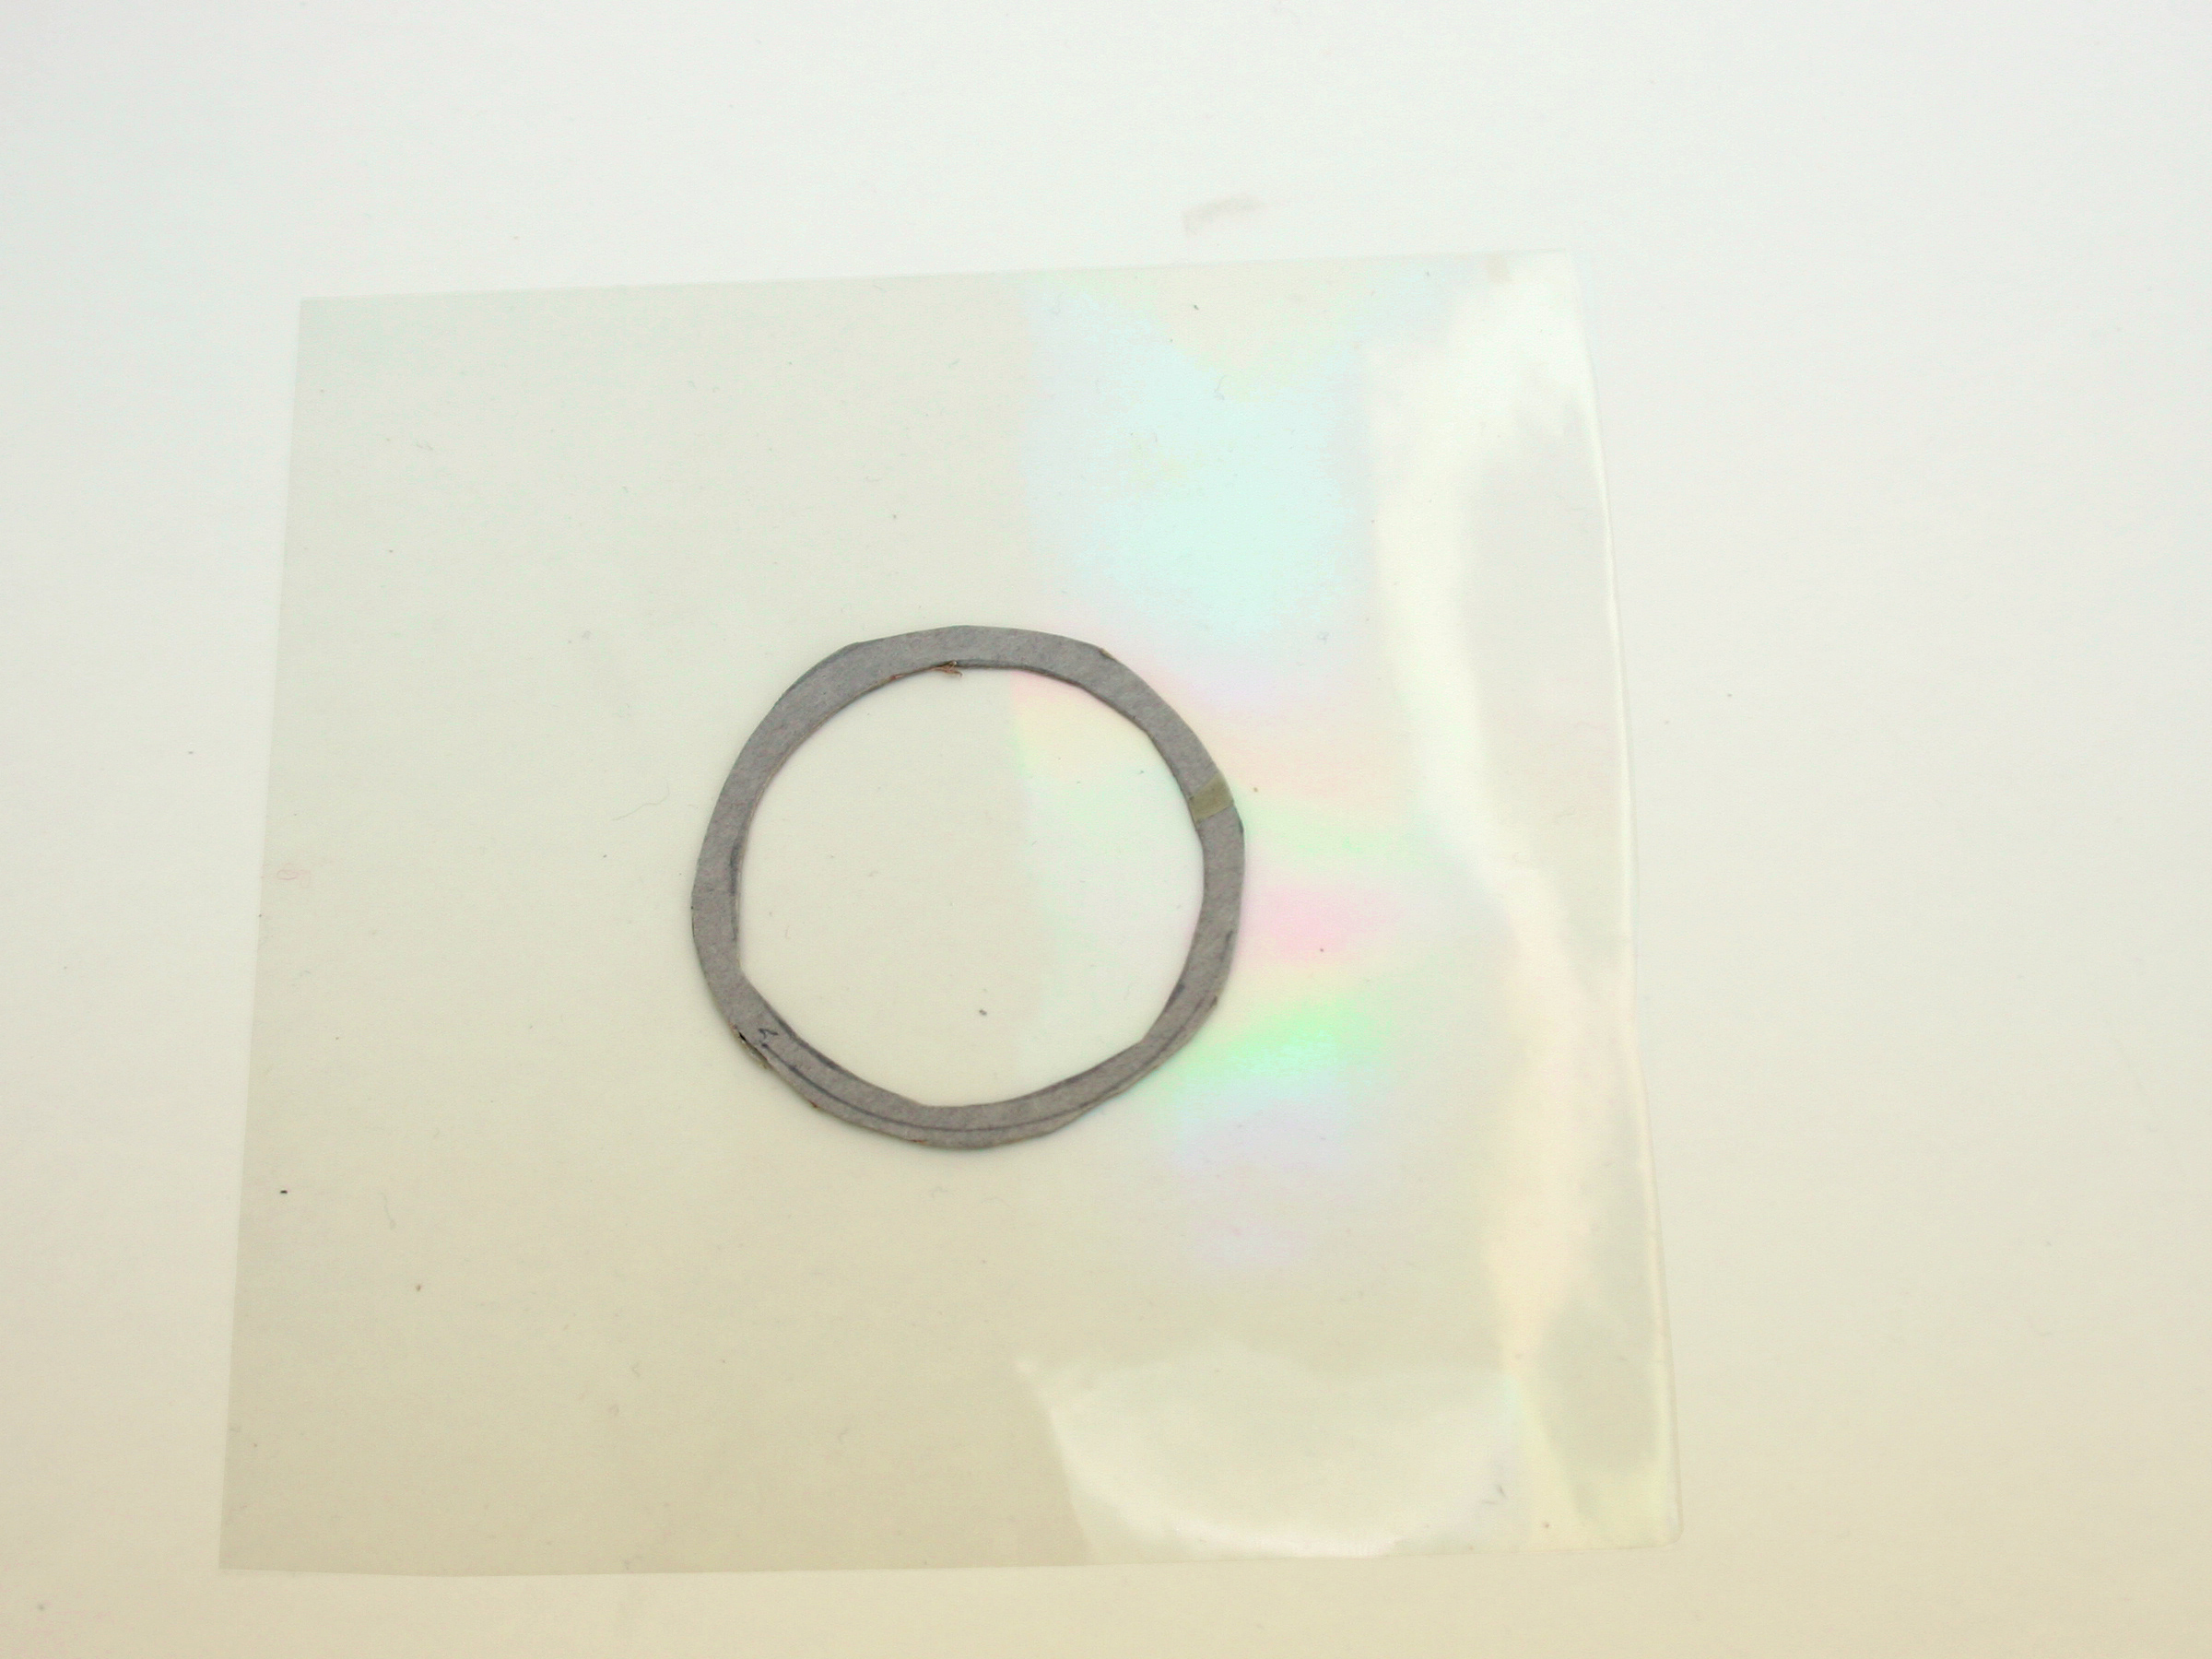
The first spectroscopes used glass prisms to split light into colors, but Fraunhofer found that an array of closely spaced wires had the same effect. Today we call these arrays of tiny slits diffraction gratings.

After these discoveries, spectrographs (the instruments used to record spectra) became a standard tool for analyzing the chemistry of almost anything, ranging from microscopic lab samples to faraway galaxies.

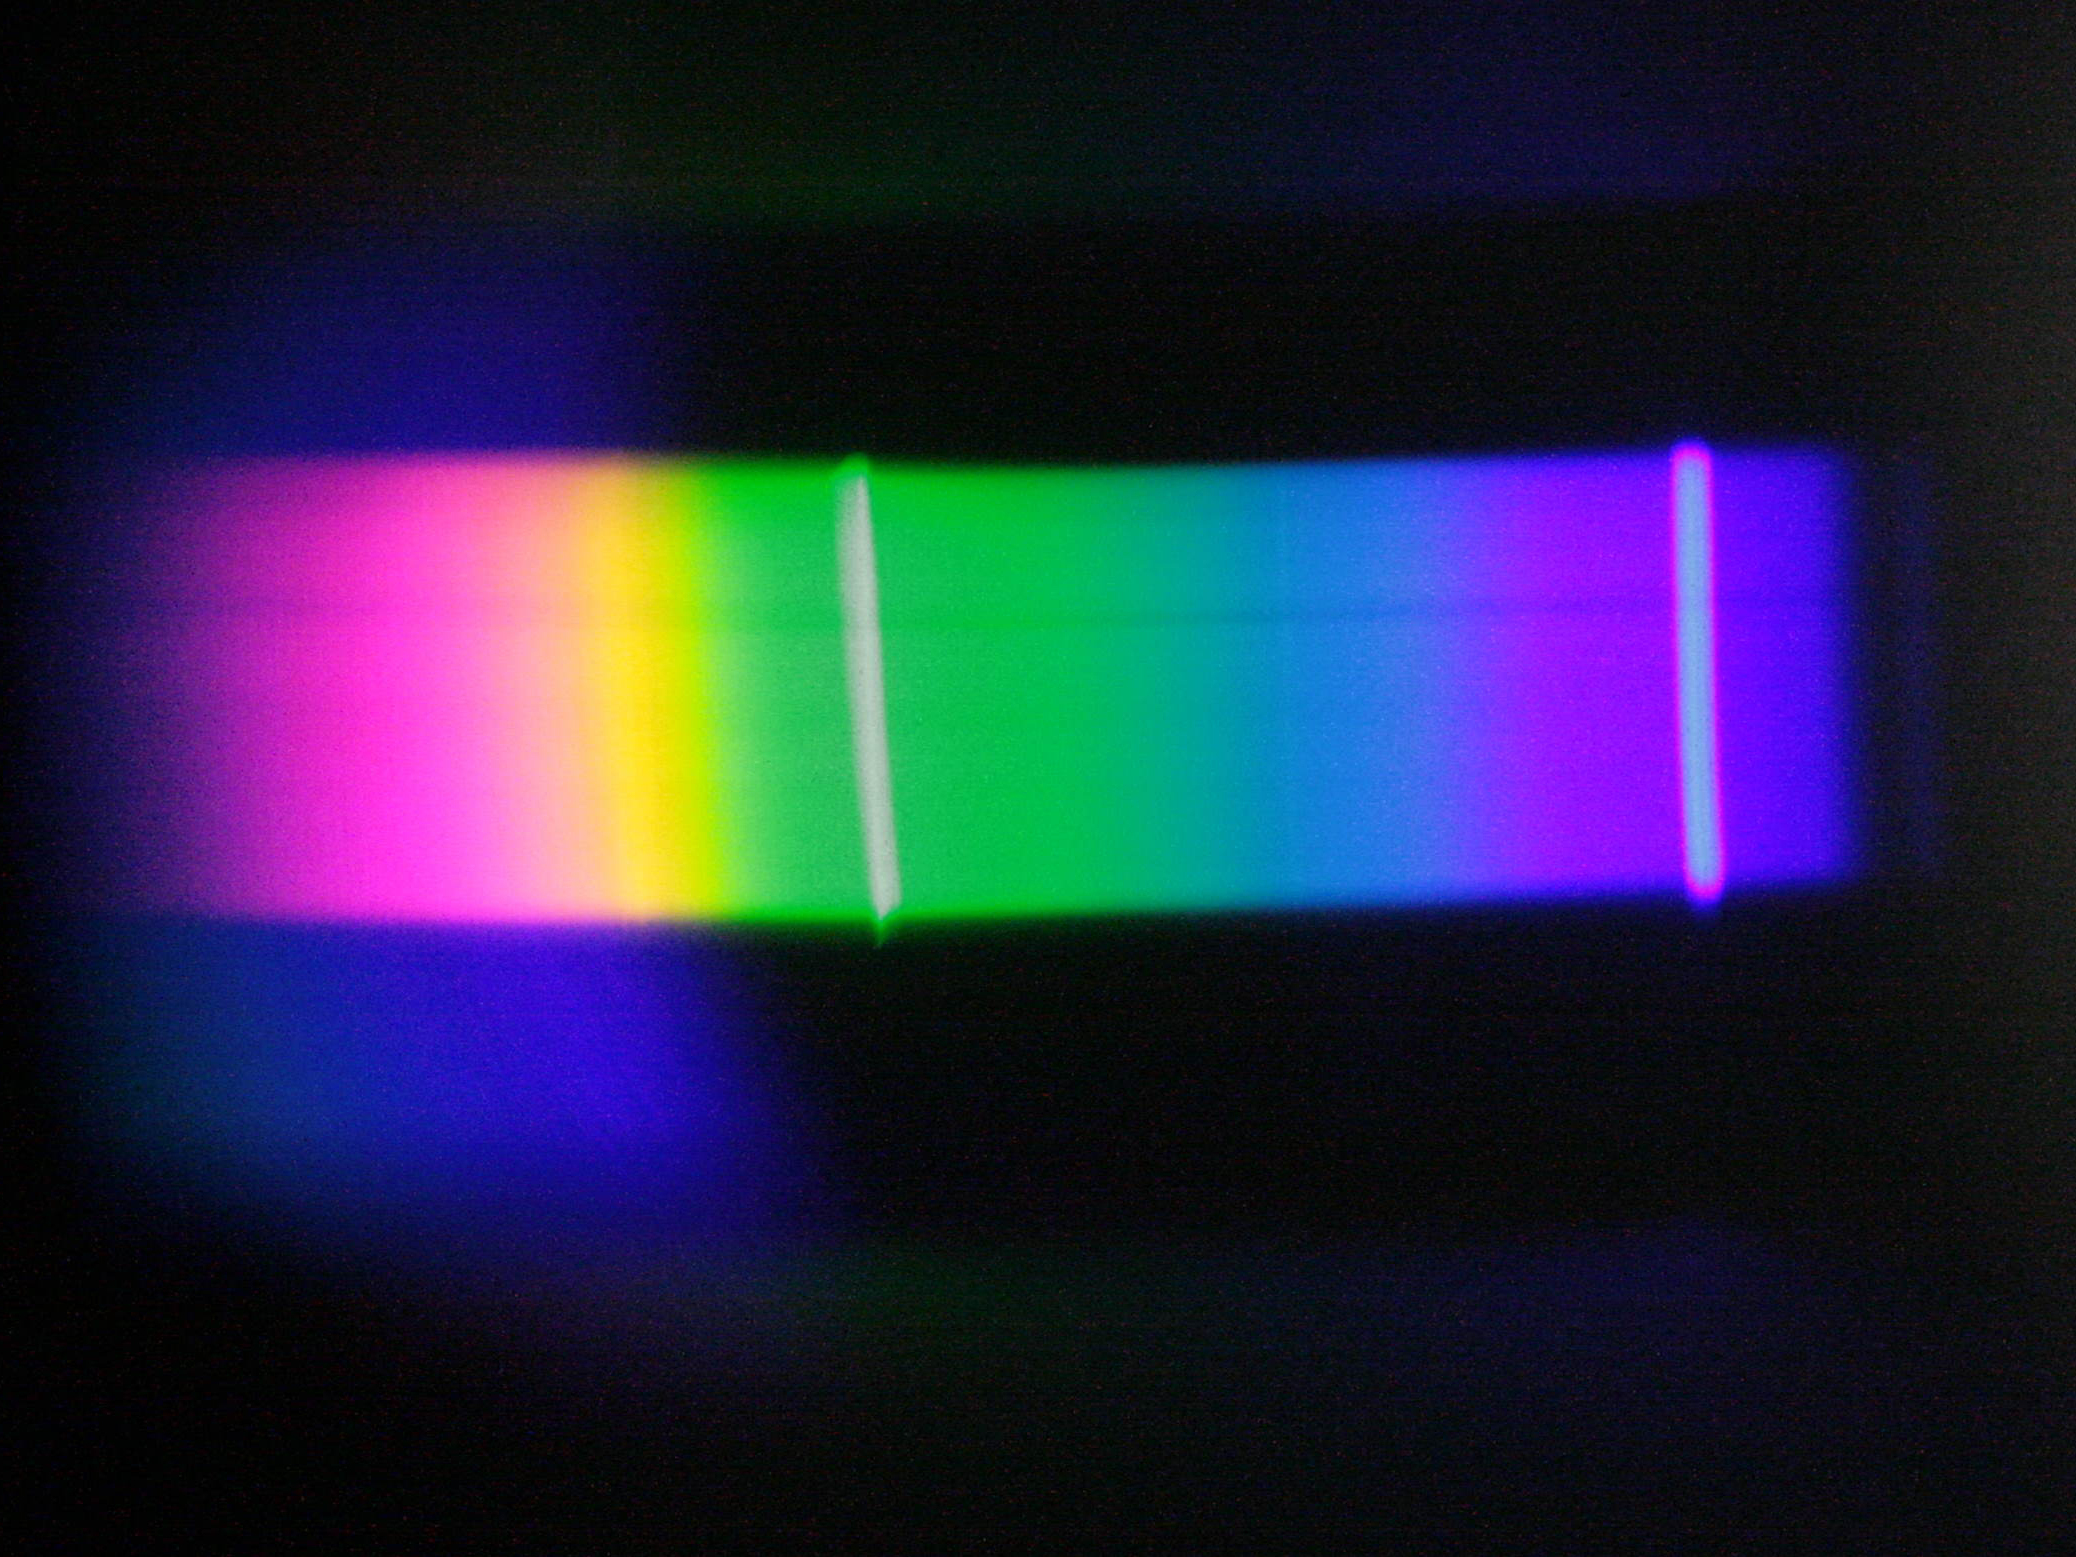
The primary element in both spectroscopes and spectrographs is a narrow slit oriented perpendicular to the direction in which the grating or prism spreads the light. As with a pinhole camera, the small aperture images the light source sharply along the spectrum’s axis, which keeps the spread of wavelengths distinct. Each image of the slit, in a slightly different color, is arrayed across the field of view in a wide spectrum image. If any wavelength is brighter or dimmer than the rest, it shows up, respectively, as a bright or dark line in the spectrum.

Although spectroscopes have always been easy to make, a homebrew recording spectrograph presented more of a challenge. Building your own spectrograph meant using microcontrollers and stepper motors to move diffraction gratings past a light sensor — many were planned, but few were actually built.

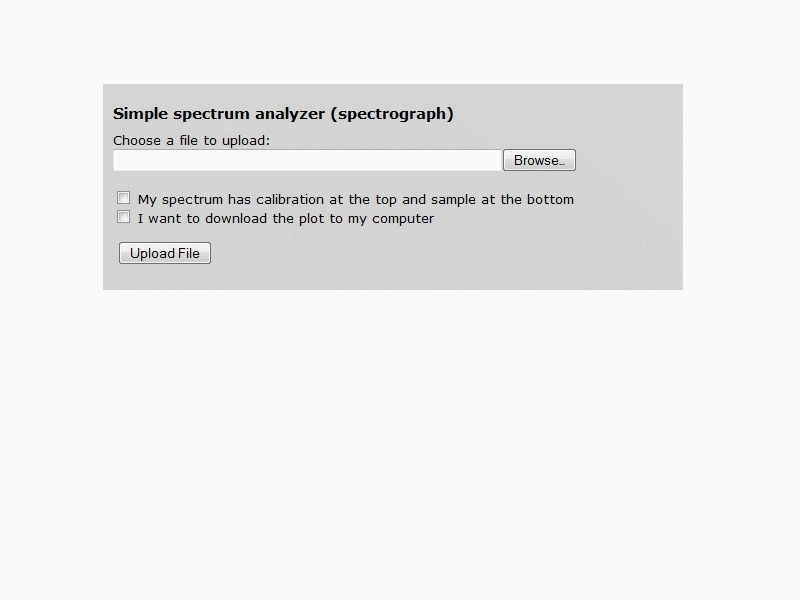
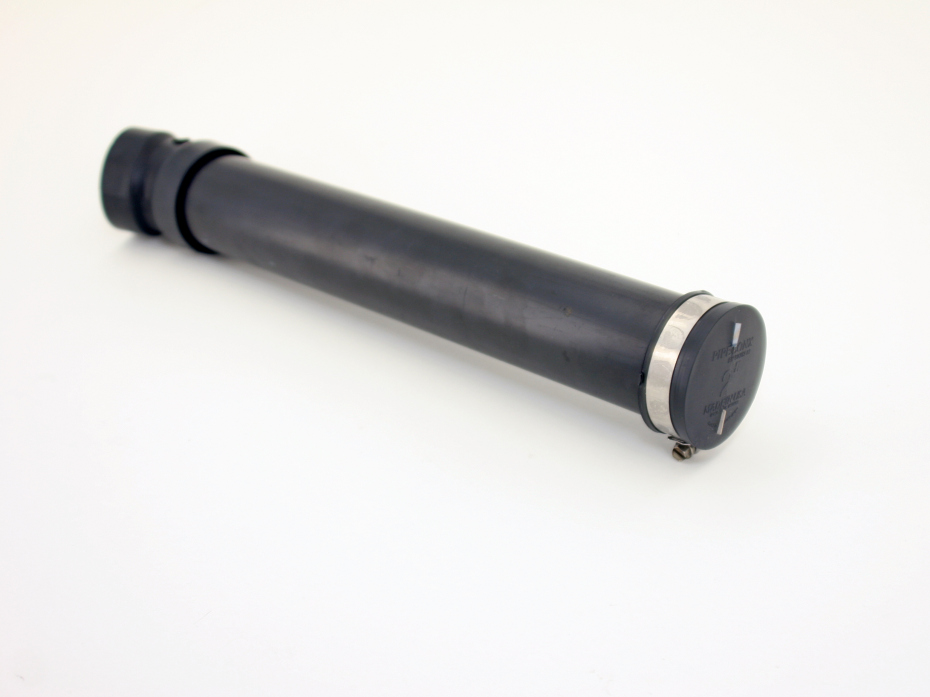
Today, digital cameras and online tools can turn a simple spectroscope into a laboratory-quality, high-resolution spectrograph. All it takes is a few plumbing parts and other inexpensive materials and less than an hour at your kitchen table.

Project Steps

Prepare the cap.

Use a ruler and X-Acto knife to cut a straight slit about 1 3/4″ long through the center of the rubber cap. Cut two 1/2″ squares of the thin cardboard and tuck them into opposite ends of the slit to hold it open. The slit is now as wide as the cardboard.

Secure the rubber cap on one end of the 2″ tube with the hose clamp. Rotate the hose clamp so that its screw is perpendicular to the slit.

Prepare inside of tube and make grating ring.

Loosely roll up the black construction paper lengthwise and slide it all the way into the tube so it fits neatly against the inside. This will serve to eliminate reflections. Use a compass to draw a ring on the thicker cardboard with an outside diameter of 2″ and an inside diameter of about 1 5/8″, and cut out the ring using the X-Acto knife. The ring should fit inside the tube snugly but without bending.

Spread a very thin layer of glue onto one side of the cardboard ring and affix it to the diffraction grating. After the glue dries, carefully cut the diffraction grating around the outside edge of the ring using the X-Acto knife.

Insert the ring and look at spectra.

Insert the diffraction grating ring into one end of the angled coupling so that the ring’s edge is flush with the interior wall, and press the uncapped end of the tube in until it’s held in place. That’s it — the tube is now a spectroscope!

To look at spectra, point the slit end up to a light source, look into the angle fitting, and rotate the rubber cap (or angle fitting) until the spectrum you see is a neat rectangle instead of a parallelogram or a thin line.

With the hose clamp’s screw perpendicular to the slit, the clamp acts as a stand, keeping the slit vertical while preventing the tube from rolling.

You can experiment with the cardboard spacer thickness. A wider slit will make a brighter image with broader lines, giving less resolution. Using a longer or shorter tube will make the slit look narrower or wider, respectively.

Capture spectra on camera.

To turn the spectroscope into something that records and analyzes the light it diffracts, we need a digital camera and the internet. Aim the camera into the spectroscope so it captures any spectrum you want to analyze, and set the zoom so it fills the viewfinder as much as possible to get the maximum resolution.

To capture the spectra of stars, you don’t need the slit. The star is a point source of light, so it acts as its own slit. Just put some grating over the telescope eyepiece, and photograph the rainbow streaks on either side of the star.

Take several pictures of the spectrum, and if your camera lets you set exposure times and apertures manually, use a range of these settings. A properly exposed image will be dark, especially if you’re capturing an emission spectrum, like from a fluorescent lamp.

Avoid the temptation to take a colorful rainbow picture, in which all the lines will be smeared out. With the fluorescent light, for example, you want just 4 or maybe 6 of the mercury lines to stand out visibly.

Analyze photos.

Download the photos onto your computer and crop them so that just the spectrum itself is visible. To analyze a spectrum image, upload it using the “Simple spectrum analyzer” form at my website at https://makezine.com/go/spectrograph.

If you upload your spectrum photo without clicking on either checkbox, you’ll get a simple spectrum plot. With my fluorescent lamp spectrum, for example, the graph shows 4 peaks. These peaks correspond to the brightest lines in the spectrum of mercury, which exists in vapor form inside the tube.

You can use a spectrum source that’s known, like our fluorescent light, as a high-precision ruler for analyzing other spectra, such as through a sample of transparent material or liquid.

To do this, you position the reference light to shine through the top half of the slit, and shine a broad-spectrum light source through your sample, covering the bottom half. Use a bit of aluminum foil to divide the slit into two parts, separating the calibration light from the sample light.

As an example, I used the fluorescent tube as a reference for testing some green clear plastic lit from behind with a white LED.

Upload the double spectrum image to the spectrum analyzer with the first checkbox checked, and you’ll get a plot of both against each other. This analysis results in 2 graphs: the calibration on top, like the graph we just looked at, and the sample spectrum on the bottom.

The plots have a nanometer scale at the bottom, which we can verify against the 4 brightest lines in mercury’s emission spectrum, as listed in the Handbook of Chemistry and Physics (CRC Press, 2009): 435.8nm, 546.1nm, 577nm, and 579.1nm.

Since both sources pass through the same slit and the same camera, calibrating this way guarantees that the frequencies in each spectrum match up exactly, and therefore that the readings are accurate.

How diffraction gratings work.

Our diffraction grating is a transparent sheet of plastic with dark lines on it spaced 1/500 of a millimeter (2µm) apart.

Light waves pass through the spaces between the lines, called slits, and interfere with waves going through adjacent slits to produce bands of light or dark where the interference is constructive or destructive.

Light bands form where the wavecrests from adjacent slits are both an integer number of wavelengths away from the diffraction grating. Since this depends on the wavelength, it causes different colors to form bright bands in different places, separating them into the rainbow we call the spectrum.