




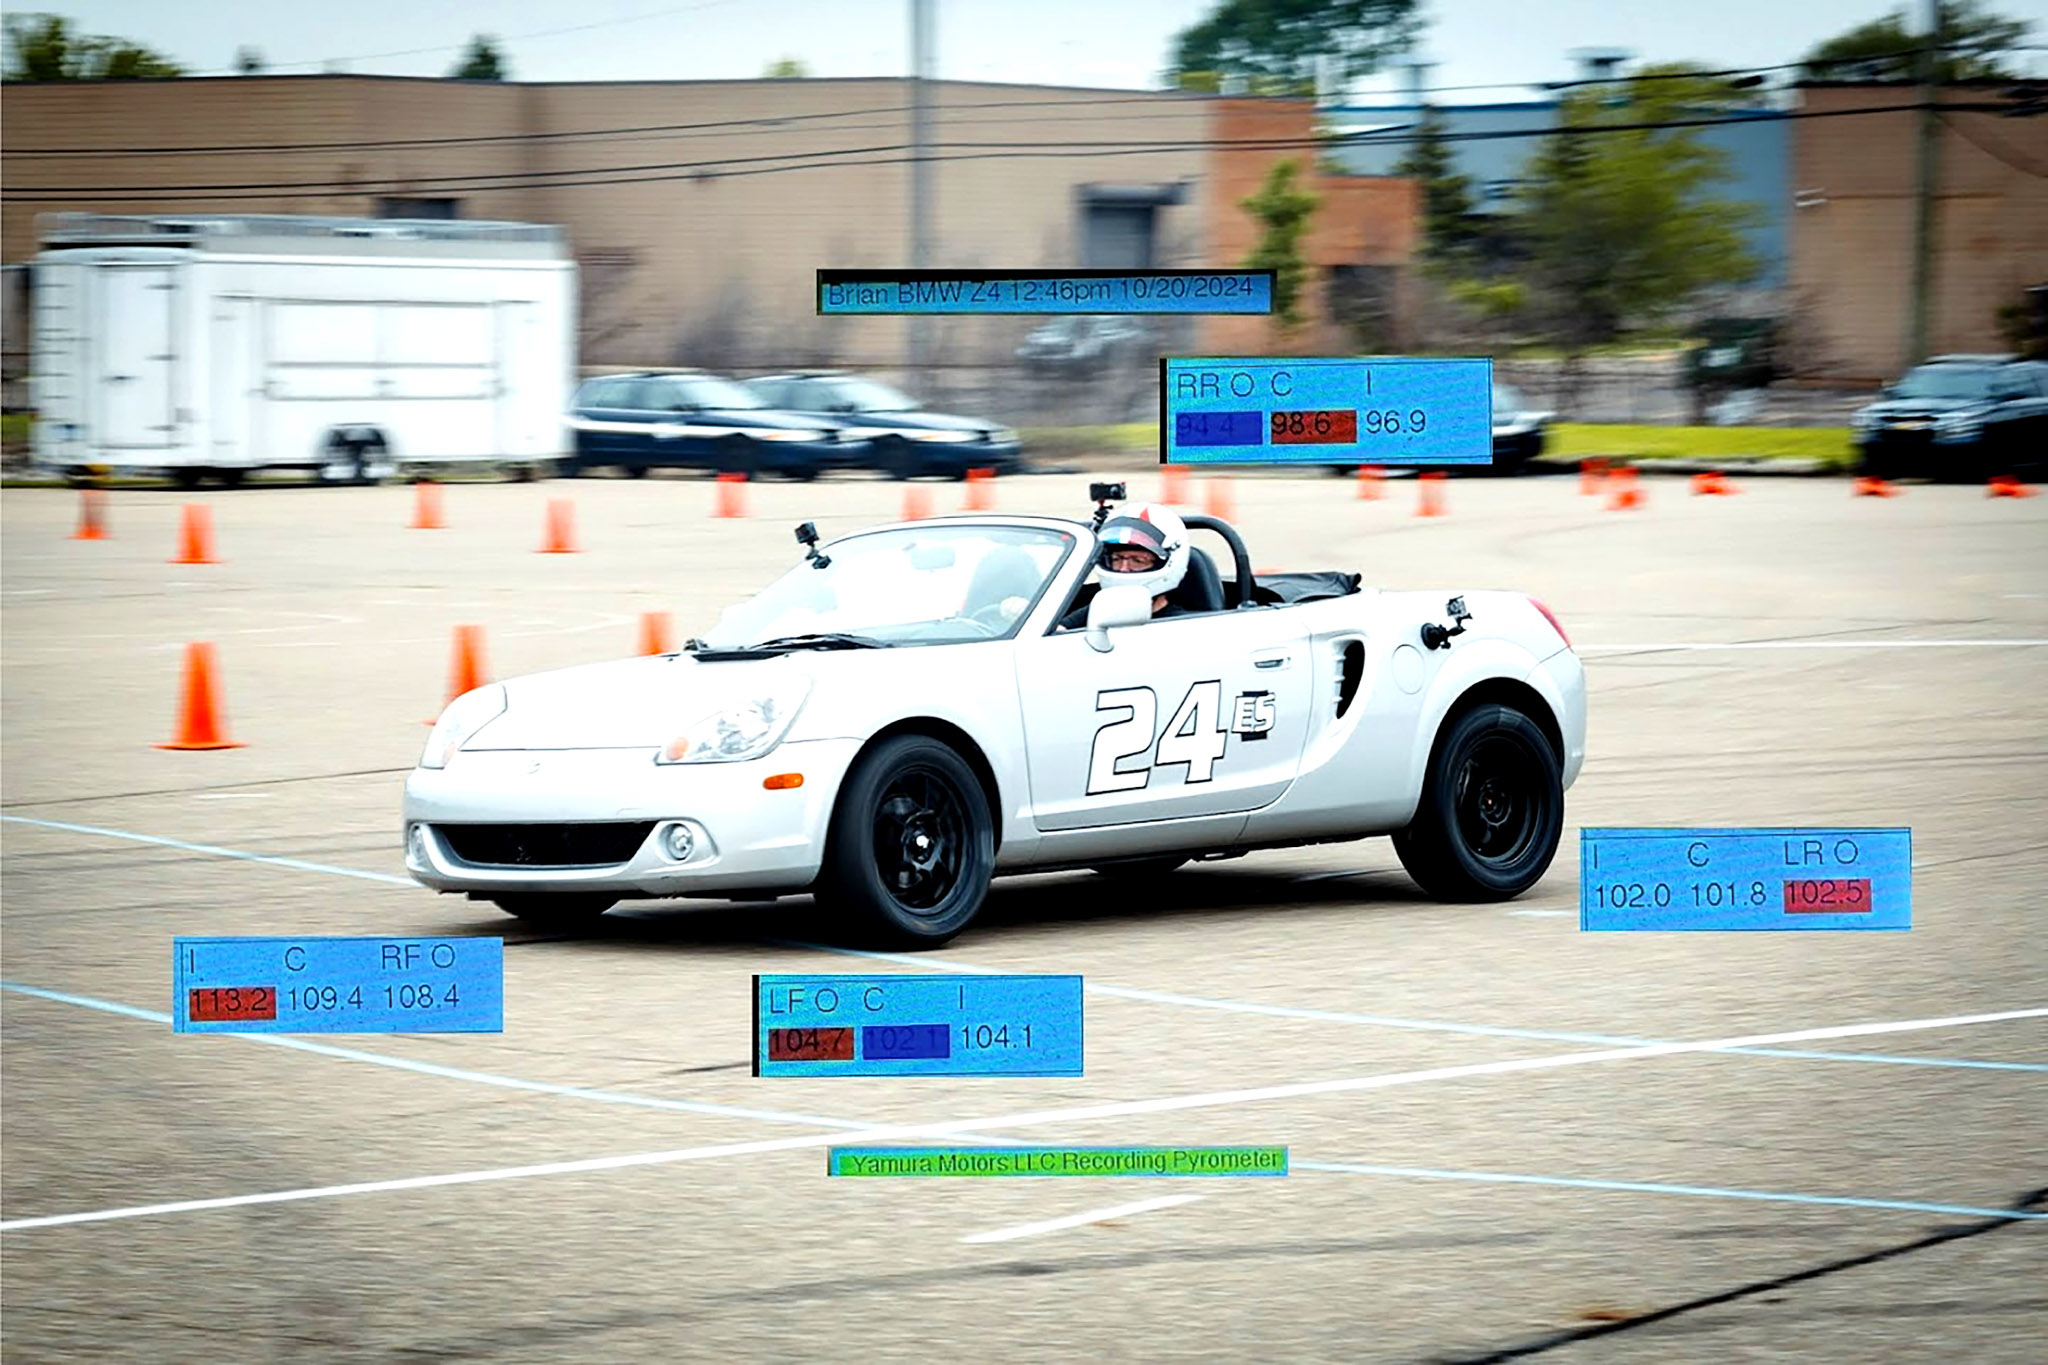
Featured photo by Alex Valenze. All other images by Brian Smith.


Cover of Make Volume 98. Headline is "Action: Projects that go Zoom! Bang! Woosh!". A small, ultralight drone that weighs less than 3 nickels is featured on the cover above a banana for scale.
This article appeared in Make: Vol. 98. Subscribe to Make: for the latest articles.

Since skipping my college graduation to buy a racing kart, I’ve raced a variety of cars over the years — sprint and enduro karts, Formula V and Formula Ford, and now SCCA Solo (autocross) with a Toyota MR2 and a BMW Z4. All very different cars with one thing in common — tires. 

Ultimately, tires determine how much grip is available for the driver to use for acceleration, braking, and cornering, so knowing their condition is an important data point for optimizing car and driver performance. In this project I’ll show how to measure and log your tire temperatures with a DIY recording tire pyrometer based on a cheap ESP32 microcontroller.

If racing’s not your passion, you can use this project as a basis for all kinds of compact, portable data recorders by changing the attached sensors. Want to get soil moisture measurements from your garden? GPS positions? Sound volume? Light brightness? Air quality? Any sensor that has an I²C or SPI interface and an Arduino library is easy to add to this basic design.

What Tire Temperatures Tell You

When talking about tire temperatures, racers refer to the inside, outside, and center of the tread. The grip available from a tire depends on how much of the tire is in contact with the ground, and the vertical force or load applied to the tire. Ideally, you want to set up the tires and suspension so the load across the tread is as even as possible, generating the most grip.

If the air pressure is too high, the contact patch shrinks as the tread crowns at the center of the tire. Too low, and the inside and outside edges of the tire do more of the work because the sidewalls are supporting more of the load. As tires heat up, so does the air inside them, so you may need to start a session with lower than ideal temperatures. Measuring temperatures and air pressures at the end of the session helps you find the right air pressure for each tire at the start.

Tires generate grip from friction, and friction generates heat. So measuring the temperature of each tire at inside, center, and outside points tells you how hard each part of the tire is working to generate grip. Ideally the temperature across the tread should be consistent, and in the best working range of the tire. If it’s above or below optimal, you get less grip. Too cool? Maybe switch to a softer tire for more grip at lower temperatures. Too hot? A harder compound tire gives more grip at higher temperatures.

It’s possible to take tire temperatures even while the car is in motion using non-contact IR thermometers. But tire pyrometers have a tire-specific temperature probe that pushes into the tread to get a more accurate temperature. With a few easily available parts and some soldering skills, you can build a recording tire pyrometer that has more features than commercially available pyrometers costing several times more.

Recording Tire Pyrometer Design

The RTP’s functions define the hardware needed:

  • Read and display tire temperatures: K-type tire pyrometer probe and K-type thermocouple amplifier; TFT display for visibility outdoors
  • Record temperatures: microSD card
  • Access the web for setup and to display results on phones/tablets: ESP32 microprocessor
  • Timestamp results: real-time clock (RTC)
  • Handheld unit: 3D-printed enclosure suitable for outdoor use
  • Support multiple car/driver/wheel configurations: simple, fast user interface
Project Steps

1. Enclosure Design

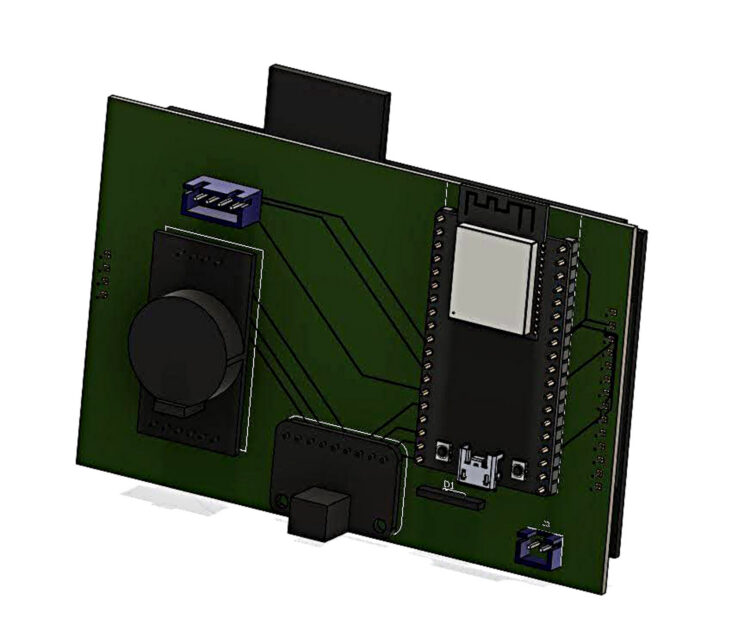
The hardest part of this project was the enclosure design! You need to use one hand for the tire probe, so the enclosure should fit comfortably in your other hand. It’s used outdoors, so it needs to be at least water and dust resistant. The screen needs to be visible, the batteries accessible, the buttons usable with one hand, and the temperature probe cable needs to be out of the way. The image shows how I laid out the PCB for the components to fit inside the box, using the electronics design tools in Autodesk Fusion.

2. Print the Enclosure

Generate STL files from your own enclosure design, or download my STL files from github.com/bbsmith24/YamuraPyrometer. There are four pieces to print: the box; the box cover that holds the display, buttons, and control board; and the battery box and its cover. I use PETG for better temperature stability. Don’t leave a PLA box sitting on your dashboard on a sunny day!

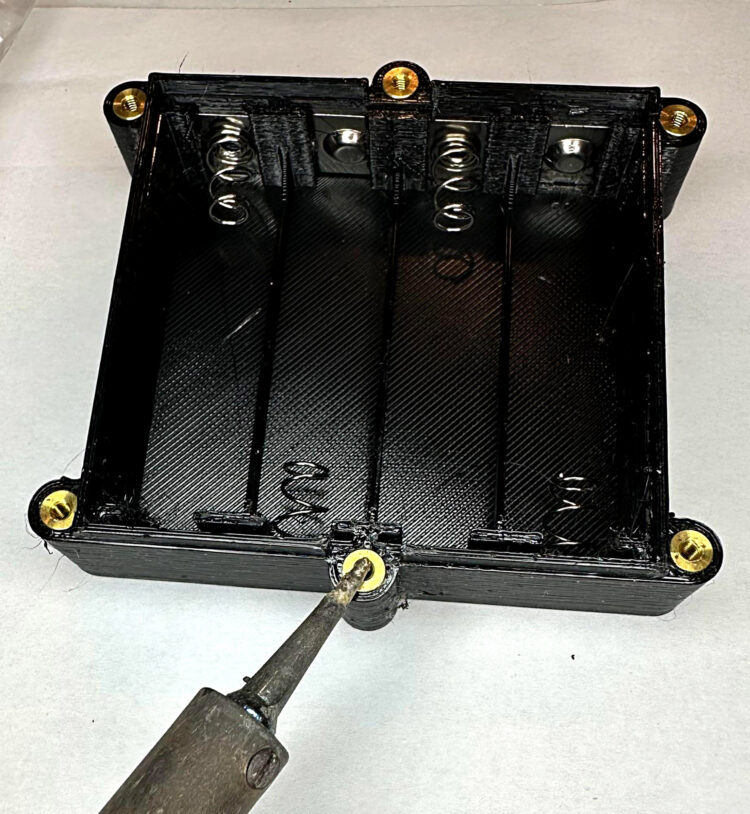
The box parts are screwed together. I use heat-set brass threaded inserts, especially for screws that will be removed frequently like the battery box cover. These are easy to add to a 3D-printed part —just push the insert into the hole as far as it will go, then push it the rest of the way with a hot soldering iron. These inserts hold in place well, and will survive many disassemble/reassemble cycles. Also press the battery terminals into the battery box as shown.

Solder the polarity protection diode to the positive terminal of the box and add wires to connect the batteries to the control board.

Install the pushbuttons in the box cover, leaving enough wire to connect to the control board. Push the thermocouple socket into its hole in the walls.

3. Electronics

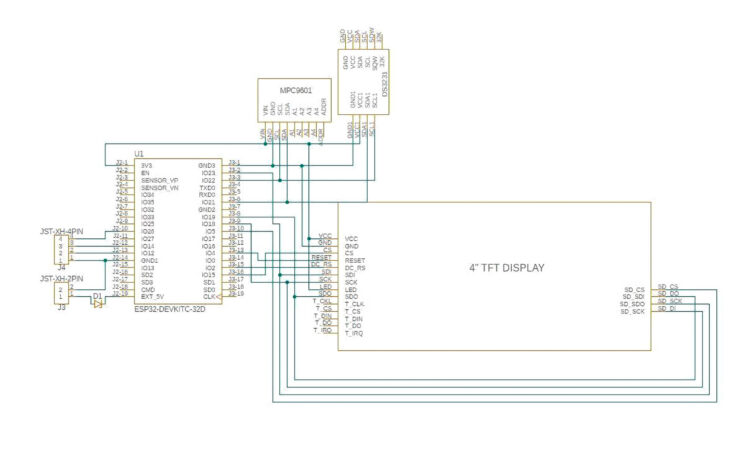
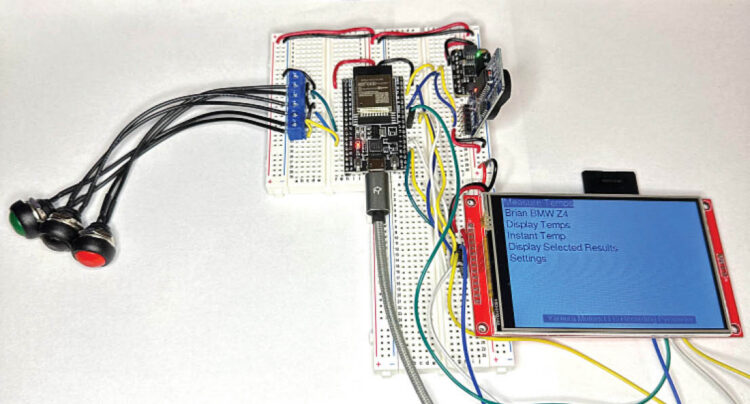
Follow the wiring diagram and lay out your components. There are a lot of connections, so I like to use consistent color wires to make checking the connections easier. You can test the whole circuit on three small breadboards before soldering the PCB.

    • POWER: Red (+) 3.3V logic; Black (–) to control board battery in and ground; and Orange (+) 5.0V battery voltage. I don’t want to accidentally supply 5V to the 3.3V chips, so I use a different color.

    • I²C BUS: Data to/from RTC clock module and thermocouple amplifier. Blue SDA, Yellow SCL.

    • TFT SPI BUS: Control TFT display, send data to/from SD card. Blue Controller SDO to Peripheral SDI; White Peripheral SDO to Controller SDI; Yellow SCK; Green chip select for TFT screen.

    • TFT DISPLAY: Red 3.3V supply to TFT screen and SD card slot; Yellow DC_RS; White RST (reset)

    • SD CARD SPI: Blue Controller SDO to Peripheral SDI; White Peripheral SDO to Controller SDI; Yellow SCK; Green chip select for SD card.

Check each bus for correct wiring as you go, using a multimeter set to continuity. Also check that there are no connections between either 5V or 3.3V and ground, and no unintended connections between adjacent pins. A little extra time now will save you headaches trying to find a shorted-out button or nonfunctional TFT display later. Shorts between 5V or 3.3V and ground are usually easier to find but more catastrophic — something will get hot and burn out.

4. Prepare MicroSD Card, Flash Firmware to ESP32

Download the firmware (YamuraPyrometer.ino) and initialization file (YamuraPyrometer.h) for the microSD card from my GitHub repo. These files contain the default settings and configuration for the RTP. Copy the files to the microSD and insert it in the slot on the back of the display board.

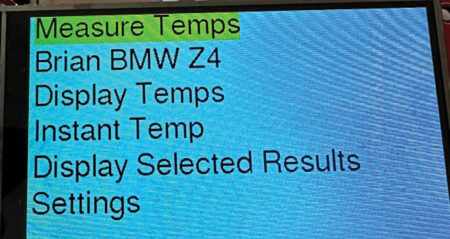
Start the Arduino IDE. Make sure all the required libraries (listed in YamuraPyrometer.h ) and board definitions are installed. Connect the ESP32 board to your computer, select the board and port, then build and flash the firmware to the ESP32. If all your connections are correct, you’ll see status messages on the screen, then the main menu. Check that the menu up, down, and select buttons work.

5. Troubleshooting

  • Arduino IDE compile errors – make sure all libraries have been installed and that the correct board is selected.
  • No status messages – check power, SPI bus and other wiring to display.
  • Can’t mount microSD – check SPI bus connections to microSD slot.
  • I2C device error (RTC or Thermocouple amp) – check power and I2C bus connections.
  • Buttons – check button wiring. It’s possible to reassign inputs if you’ve accidentally soldered a button to the wrong pin on the ESP32 module.

6. Take Tire Temps!

Using Your RTP

Use the up and down buttons to change the highlighted action. Use the select button to choose the highlighted action:

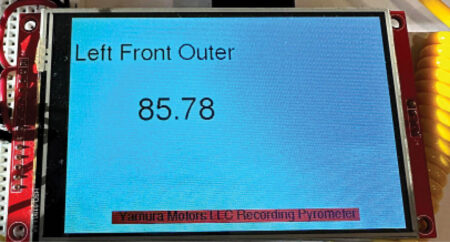
    • Measure Tire Temps: The display shows the current tire and measurement position; **** indicates measurement hasn’t started. Push the tip of the probe into the tire tread and press the select button to start measuring. Temperature is displayed while it stabilizes. After it stabilizes, repeat for the next tire/position.

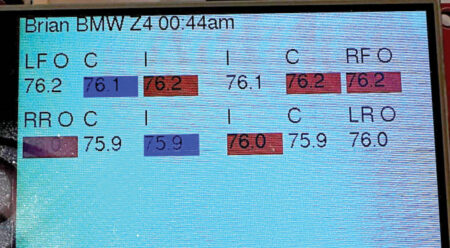
At the end of the measurement cycle, all temperatures are displayed in a grid. Highest temperature for each tire is highlighted in red, lowest in blue. Press select to return to main menu.

    • Select Car/Driver: Choose the driver/car for the next measurement.

    • Display Temps: Most recent results, in a grid.

    • Instant Temp: Useful for measuring current ambient temperature or track temperature.

    • Settings: Set various device parameters

Using the Wi-Fi Interface

Connect to the YamuraPyrometer Wi-Fi network from a phone, tablet, or computer. Open a browser and enter the IP address of the RTP (shown in the setup page). The first time, you’ll need to use <password> to connect.

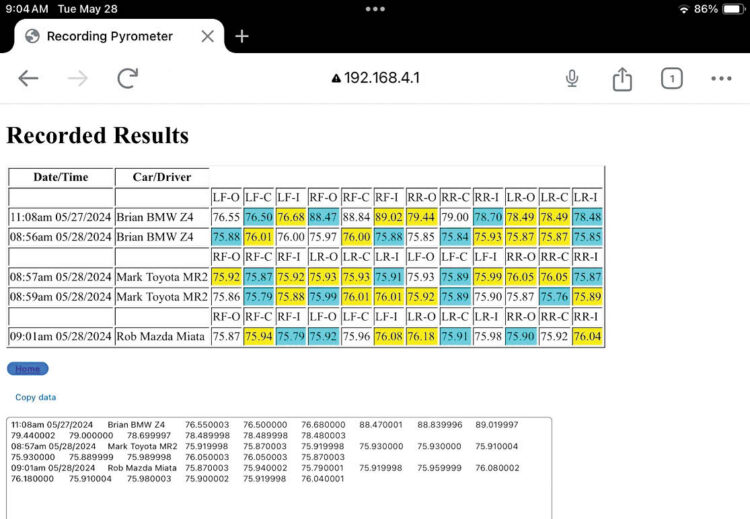
Now you can review recorded temperatures and car/driver settings, or change the settings of the RTP.

7. Firmware and File Updates Using ElegantOTA

To upload new firmware and files to LittleFS file system see randomnerdtutorials.com/esp32-ota-elegantota-arduino/

For uploading firmware, ElegantOTA works just like a serial cable – specify the file to upload, it’s loaded into the module’s program space.

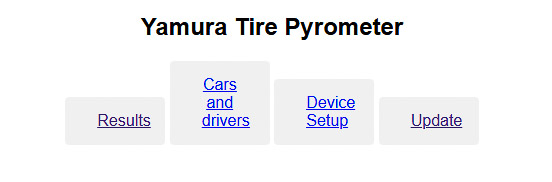
To create the firmware file, select ‘Sketch’, then ‘Export Compiled Binary’ in the Arduino IDE. This will create a file named “<sketchname>.ino.bootloader.bin” in your user folder (C:\users\<username>\temp). Connect to the RTP, select ‘Update’ from the main menu.

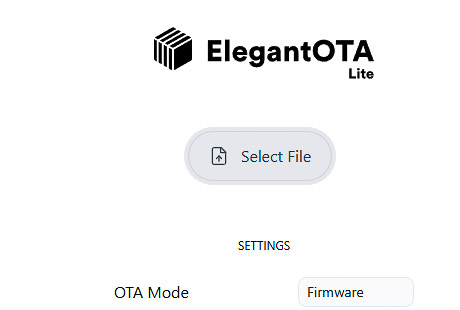
On the ElegantOTA page, make sure OTA Mode is set to ‘Firmware’, then click ‘Select File’. Find the exported firmware file, select it. The upload will start, and the RTP will reboot when the new firmware is loaded.

For transferring data files, ElegantOTA loads the files to the ESP32 flash memory accessed by the LittleFS library. Files in flash memory are retained between restarts and power cycles. But it’s not a huge amount of space, so data files and HTML files used for the web interface are stored on the microSD card. You can upload sample data and setup files (py_cars.txt, py_setup.txt) and the home page of the web interface py_main.html. Any files found in LittleFS are copied to the microSD when the module boots, then deleted from LittleFS by the RTP firmware. Don’t bother copying the subpages (results, car setup, device setup) – these are generated in real time, so you have to change the functions in the firmware that create these files.

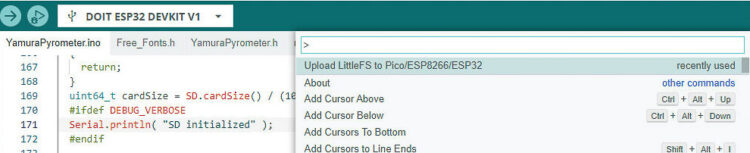
To upload files, start by installing the appropriate version of the LittleFS uploader tool in the Arduino IDE. Here are the tutorials for Arduino IDE 2 and Arduino 1.8.x. Put the file(s) to be uploaded in the “data” folder in your sketch folder, then run the LittleFS uploader with the RTP ESP32 disconnected. This creates a .bin file that you will upload to the RTP using ElegantOTA. For Arduino 2, <ctrl><shift>P to get the plugins menu, then select ‘Upload LittleFS’.

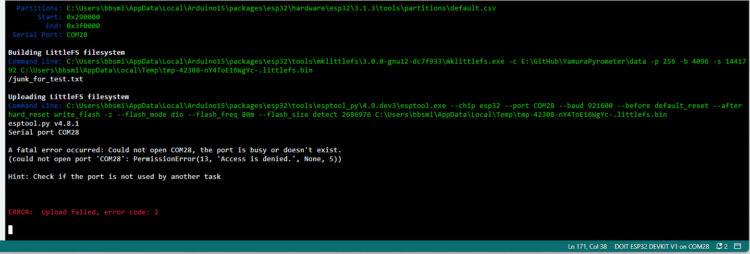
The output window shows where the file was created.

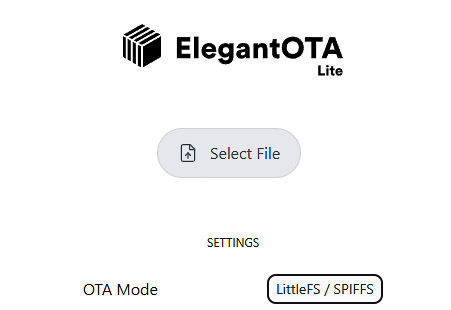
From the main menu, select ‘Update’ to get to the ElegantOTA page. Make sure OTA Mode is ‘LittleFS/SPIFFS’, click ‘Select File’ and choose the file listed in the Arduino IDE output. It will upload to the RTP. To get the files copied to the microSD card, you will have to restart the RTP.

8. At the Track — Applying What You’ve Learned

You’ve just completed your run through the cones. You’ve measured your tire temps, and you’ve got 10 or 15 minutes before your next run. What can you do to get more grip and improve that next run?

Adjust Tire Pressure

If the center of the tire is the hottest part of the tread, the tire is probably overinflated. If the center of the tread is the coolest part, that tire is probably underinflated. Add or release air to adjust the tire pressure. Adjust in small increments of a few psi for each tire as needed, and keep records so you know what changes you made.

Cool Your Tire(s)

If you’ve watched NASCAR, IndyCar, or F1 races in person or on TV, you have seen drivers weaving their cars on the warm-up lap – this is to get heat into the tires to get them to their peak grip temperature. In autocross, you get no warm-up lap – the tires need to work right from the start of the run. Over the course of several runs, heat builds up in the tires.

This is good, until it isn’t. Just like a cold tire, an overheated tire has less grip than a tire in its optimal temperature range. Tires that worked well on the second or third run of the day may have less grip for the fourth or fifth run due to heat buildup. Since you’re learning more about the course on each run, you want your car to be at its best on the last run, when you’ve learned the best way through the course and are most likely to set your fastest time. As you get to know your tires, you will learn the temperature where grip starts decreasing.

To cool your tires between runs, you can spray them with water. You might only need to cool one tire (the outside front tire on the majority of turns), both tires on one side of the car, or all four tires. On cooler days, you may want to cover your tires with blankets to keep heat in them between runs (tire warmers like you see in F1 aren’t allowed at club events).

Suspension Adjustments

You may be able to make some suspension adjustments like shock absorber firmness between runs at the event. For others, you’ll have to wait to get the car back to your garage. The most typical adjustment based on tire temperature is camber. Camber measures the angle from vertical of the wheel – negative camber means the wheel tilts in at the top, positive camber means it tilts in at the bottom. High inside edge temps indicate too much negative camber, high outside edge temps mean too much positive camber.

Toe-in/toe-out can also impact the tire temperature. Toe-in means the front of the wheels are closer together than the back, toe-out is the opposite.

Shock and Sway bar settings (if adjustable) will change the characteristics of the car – soften the axle with the least grip (understeer or ‘push’ if the car wants to go straight in corners, oversteer or ‘loose’ if the rear of the car wants to slide out in corners)

On a 4-wheel independent suspension car, camber and toe are adjustable at each wheel. For cars with solid rear axles, camber and toe are adjustable on the front wheels.

Other Factors

Every autocross event is different – the track layout is different every time, the pavement at different event locations may be grippy (new concrete) or slippy (old worn asphalt). If you’re running early in the day, there will be dust/dirt/oil on the surface to make it slippery. Later in the day, dust and dirt will be cleared by earlier runners, and rubber gets worked into the surface which improves grip. The track surface temperature will be different – cold on a cool, cloudy, or rainy day; hot on a clear sunny day. Keep good records, this will help you learn what works best for your car in different conditions.

As you gather more data and experience, you will learn the tire pressures, wheel camber, and other settings needed to generate the right amount of heat in your tires for the best grip.

Resources

Arduino Libraries

If you are using the TFT display from the parts list above, make the following changes to …TFT_eSPI\User_Setup.h.

Line numbers for version 2.5.43

Comment ILI9341_DRIVER (line 45)

//#define ILI9341_DRIVER // Generic driver for common displays

Uncomment ILI9486_DRIVER (line 53)

#define ILI9486_DRIVER

Add TFT_WIDTH 480 and TFT_HEIGHT_320 (lines 89-93)

// #define TFT_WIDTH 240 // ST7789 240 x 240 and 240 x 320
#define TFT_WIDTH 480
// #define TFT_HEIGHT 160
// #define TFT_HEIGHT 128
// #define TFT_HEIGHT 240 // ST7789 240 x 240
#define TFT_HEIGHT 320 // ST7789 240 x 320
// #define TFT_HEIGHT 240 // GC9A01 240 x 240

Comment out TFT SPI pin definitions (lines 170-177)

//#define TFT_MISO PIN_D6 // Automatically assigned with ESP8266 if…
//#define TFT_MOSI PIN_D7 // Automatically assigned with ESP8266 if…
//#define TFT_SCLK PIN_D5 // Automatically assigned with ESP8266 if…
//#define TFT_CS PIN_D8 // Chip select control pin D8
//#define TFT_DC PIN_D3 // Data Command control pin
//#define TFT_RST PIN_D4 // Reset pin (could connect to NodeMCU RST…

Uncomment TFT SPI pin definitions (lines 212-216)

#define TFT_MISO 19
#define TFT_MOSI 23
#define TFT_SCLK 18
#define TFT_CS   15  // Chip select control pin
#define TFT_DC    2  // Data Command control pin
#define TFT_RST   4  // Reset pin (could connect to RST pin)

Uncomment SPI_FREQUENCY 20000000, comment out 27000000 (lines 363-363)

#define SPI_FREQUENCY  20000000
// #define SPI_FREQUENCY  27000000

If you use a different display, you will need to read the documentation to modify the user_setup.h file for your display. You may also need to modify the mySetup_ST7796_ESP32.h file for different displays or if you change SPI pins.

  • ESP_Async_Webserver Asynchronous HTTP and WebSocket Server Library for ESP32, ESP8266 and RP2040
  • AsyncTCP Async TCP Library for ESP32 Arduino
  • ElegantOTA github.com/ayushsharma82/ElegantOTA
  • Simple over the air updates to firmware and data files, so if there’s a firmware update needed you don’t have to open the box and connect a USB cable.
  • To use with async web server, change #define ELEGANTOTA_USE_ASYNC_WEBSERVER 0 to #define ELEGANTOTA_USE_ASYNC_WEBSERVER 1 in ElegantOTA.h.

Conclusion

MORE RACE DATA PROJECTS

Serious racers use data to go faster. I’ve made a few spinoffs of the recording tire pyrometer. You can build these too:

Race Data Logger:

Often there’s no time between runs to pull out the microSD card for reading on another device. This race data logger project uses an ESP32 running Adafruit Airlift so I can log and read speed and position (GPS), acceleration (IMU), steering, and throttle data remotely on a tablet or laptop.

Multi-turn String Rotation/Displacement Sensors

I needed a couple of string potentiometers to measure steering angle and throttle position, but the prices gave me major sticker shock! So I made my own string pots for around $20 using a donor retractable spring and a magnetic rotation sensor.

Cheap Yellow Hotspot

At the track, there’s generally no Wi-Fi available. To quickly transfer data between the logger and viewer, I use FTP to send the file wirelessly. For cheap, battery-powered Wi-Fi, I use this ESP32-based Cheap Yellow Display that boots in station mode and provides a hotspot.


This article appeared in Make: Volume 98.